Figure 3.

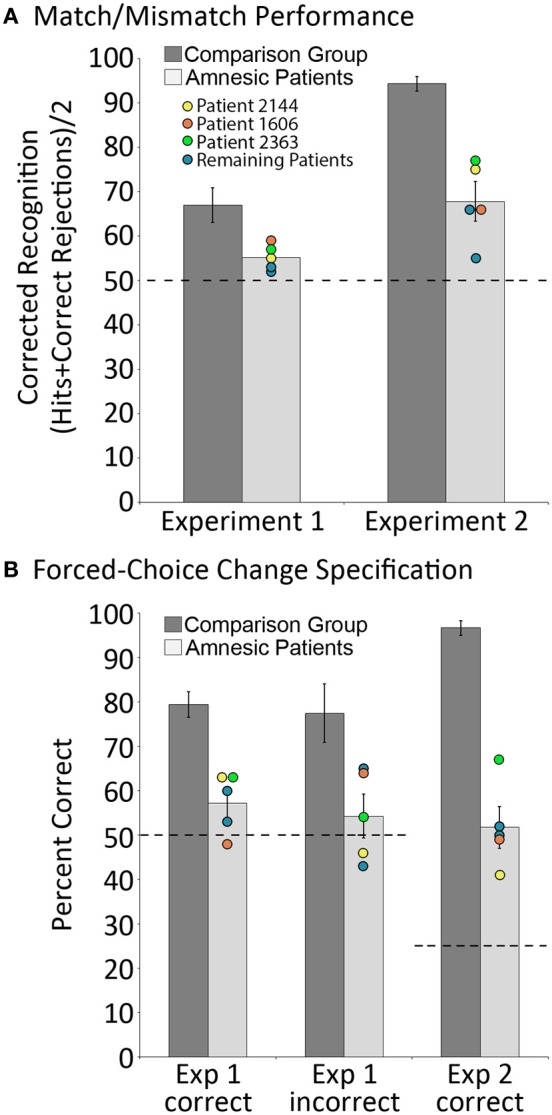
Behavioral results. (A) corrected recognition on the match/mismatch test in Experiments 1 and 2, for amnesic patients (light gray bars) and comparison participants (dark gray bars); (B) proportion correct on the change specification test in Experiments 1 and 2, contingent on whether mismatching scenes were successfully identified (“Correct”) or not (“Incorrect”), for amnesic patients (light gray bars) and comparison participants (dark gray bars). Individual performances for each patient are indicated, and the performances of three patients with noteworthy anatomical profiles—one with damage limited to hippocampus (2144, yellow) and two with more extensive damage that includes either the parahippocampal region (1606, orange) or the parietal lobe (2363, green)—have been highlighted. Error bars represent standard error of the mean. Dashed lines represent chance level performance.
