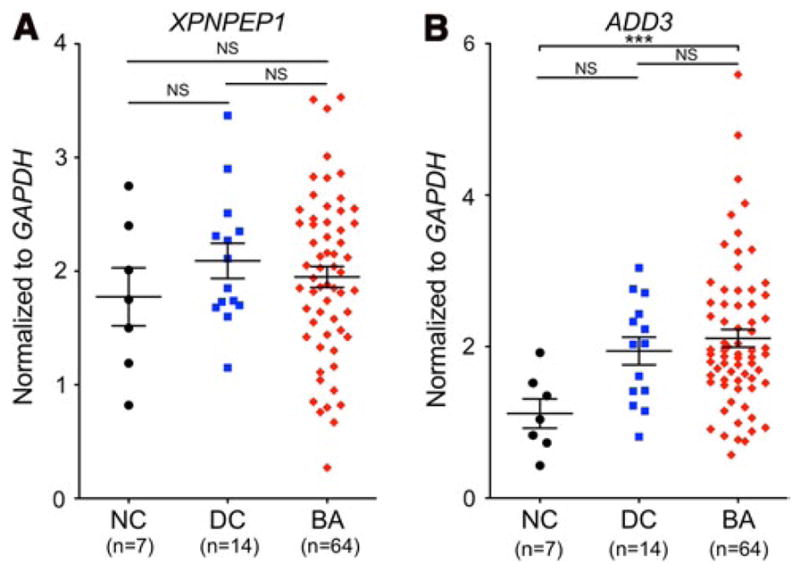
Fig. 3.

Relative expression of ADD3 and XPNPEP1. The expression levels of XPNPEP1 and ADD3 were measured in normal controls (NC), disease controls (DC), and BA patients (BA). The comparisons between these groups were not significant (NS) for XPNPEP1. A significant difference was detected (***p < 0.001) between the NC and BA for ADD3
