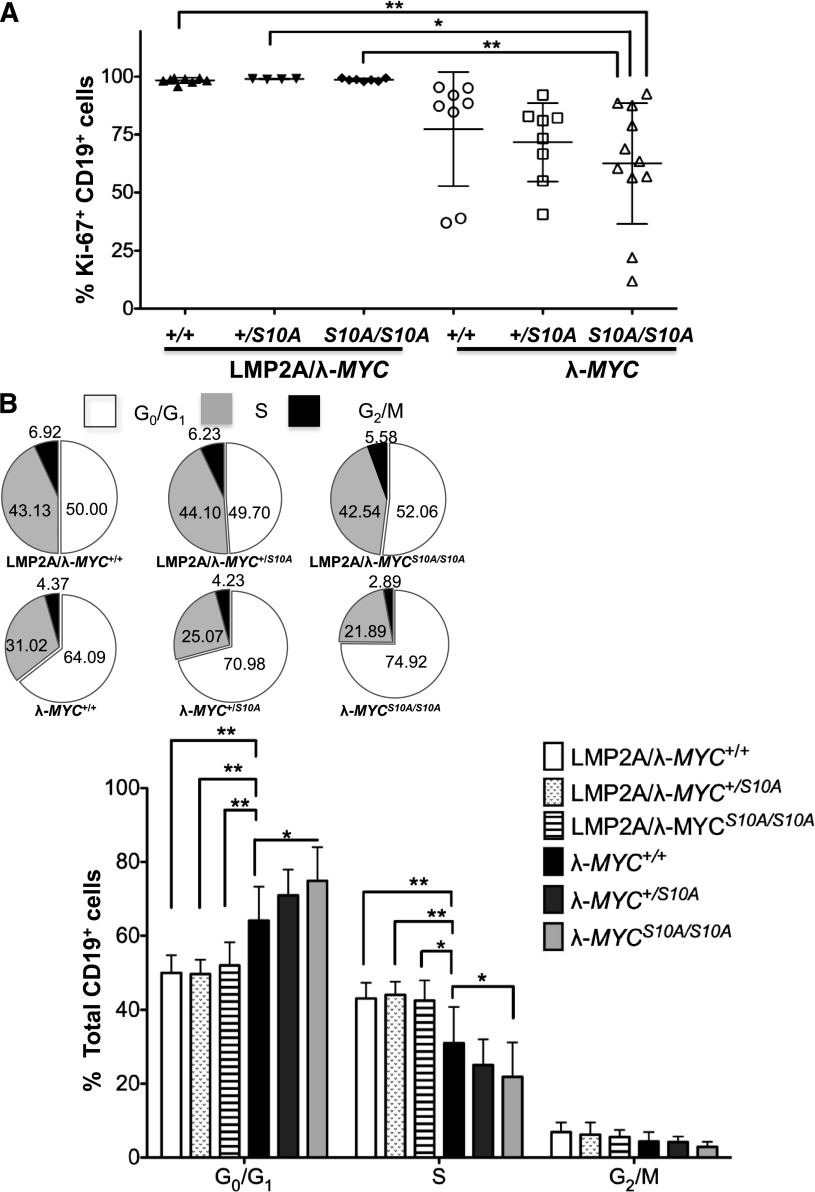
Figure 5.
Homozygous p27S10A expression significantly decreases S-phase pretumor B cells from λ-MYC mice but has no effect in LMP2A/λ-MYC pretumor B cells. (A) Percentage of Ki-67+ pretumor B cells of each genotype. Data were combined from 5 experiments and represent the mean ± SD. (B) Pie charts and bar graphs demonstrating the cell cycle profile of pretumor B cells. Data were analyzed with 1-way ANOVA and represent the mean ± SD. *P < .05, **P < .01. The inset shows pie charts representing mean percentages of pretumor B cells in each phase of the cell cycle.

