Fig. 3.
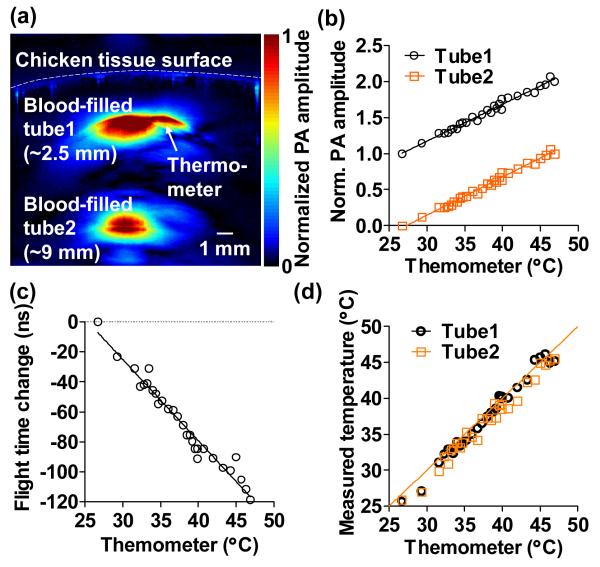
Absolute temperature measurement in deep tissue. (a) Representative cross-sectional image acquired at 800 nm, showing two blood-filled tubes embedded in chicken breast tissue at depths of ~2.5 mm and ~9 mm, respectively. A thermometer was also embedded at the same depth as the top tube. (b). Relative changes in the PA amplitudes from the two tubes followed the same slopes as a function of thermometer readings, which indicated the homogeneous temperature distribution in the tissue. The signals were shifted for clarity. Solid lines: linear fitting. (c) Change in the acoustic flight time between the two tubes as a function of temperature. Solid line: first-order rational fitting. (d) Absolute temperatures measured at the top and bottom tubes as a function of the thermometer readings. Solid line: y = x.

