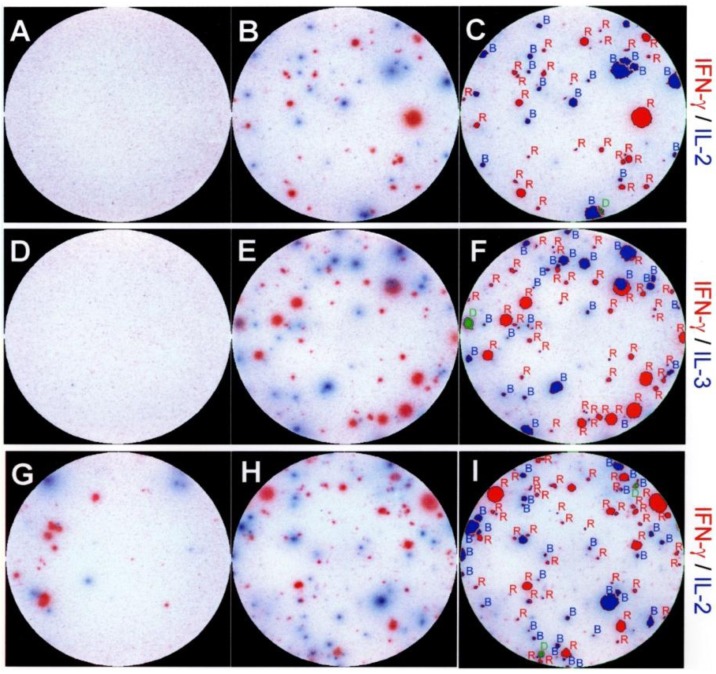
Figure 2.
Representative images of double color ELISPOT wells showing dissociated production of interleukin (IL)-2, IL-3 and IFN-γ by individual PLP:139-151 specific CD4 cells. In panels (A-F) CD4 cells purified from dLN seven days after the immunization with PLP:139-151 peptide. In panels (G-I) freshly isolated spinal cord mononuclear cells were tested with naive splenic APC on day 21, during the second episode of paralytic EAE. The medium control wells are shown on the left (A,D,G), wells containing the PLP:139-151 peptide (at 20 mM) are shown in the middle (B,E,H). The cytokine pair measured is specified on the right whereby the color of the substrate and the name of the cytokine are matched. The wells shown have been selected from serial dilutions of T cells; for better visual representation, they were also chosen to have optimal cell density and comparable numbers of red and blue spots. The result of two color image analysis of the peptide-stimulated wells (B,E,H) is shown in the panels on the right (C,F,I) as an overlay of the analyzed image and the original image. Single positive (blue or red spots) are outlined and labeled in red or blue, double positive spots are marked in green. Two color image analysis was performed as described previously [6] and in Experimental Section 4.3.

