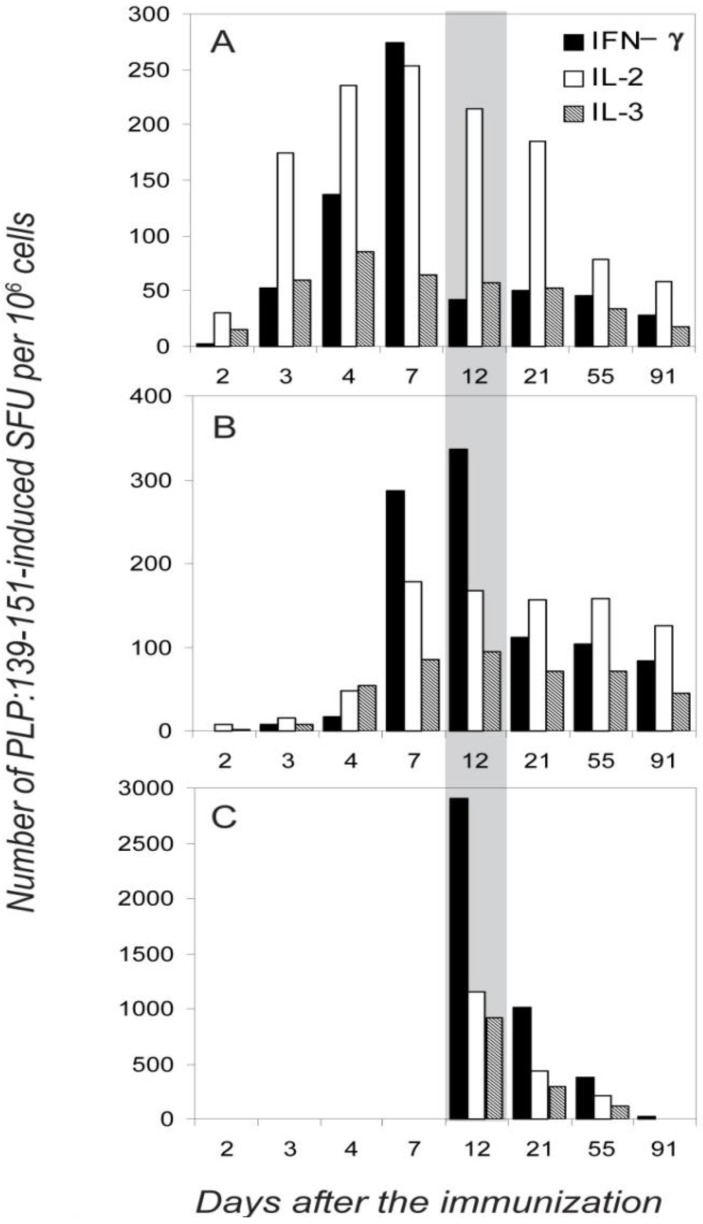
Figure 5.
Different organ distribution of PLP:139-151-specific single-cytokine producing T cells during the course of EAE. The frequencies of PLP:139-151-induced IFN-γ, IL-2 and IL-3 spots are shown per one million of mononuclear cells in the dLN (A), spleen (B) and spinal cord (C) measured at different time points after the immunization: days 2, 3, 4 and 7 (before the onset of EAE,) at day 12 (during the first paralysis), and at days 21, 55, and 91 (during the first, second and third relapses of paralytic EAE). The data shown are for T cell activation with 20 mM PLP:139-151. Because the frequencies of double positive cells were consistently <7%, they are not included in the figure. In each experiment mean spot numbers were calculated from three–four replicate wells, SD between replicate wells for all data points did not exceed 10%. For each time point, mean values are shown for data obtained in three independent experiments, testing four mice individually in each experiment. SD between the experiments was <15%. Because statistical analysis included intra- and inter- experiment data and because experimental errors were much lower then differences between data points we aimed to highlight, error bars are not shown.

