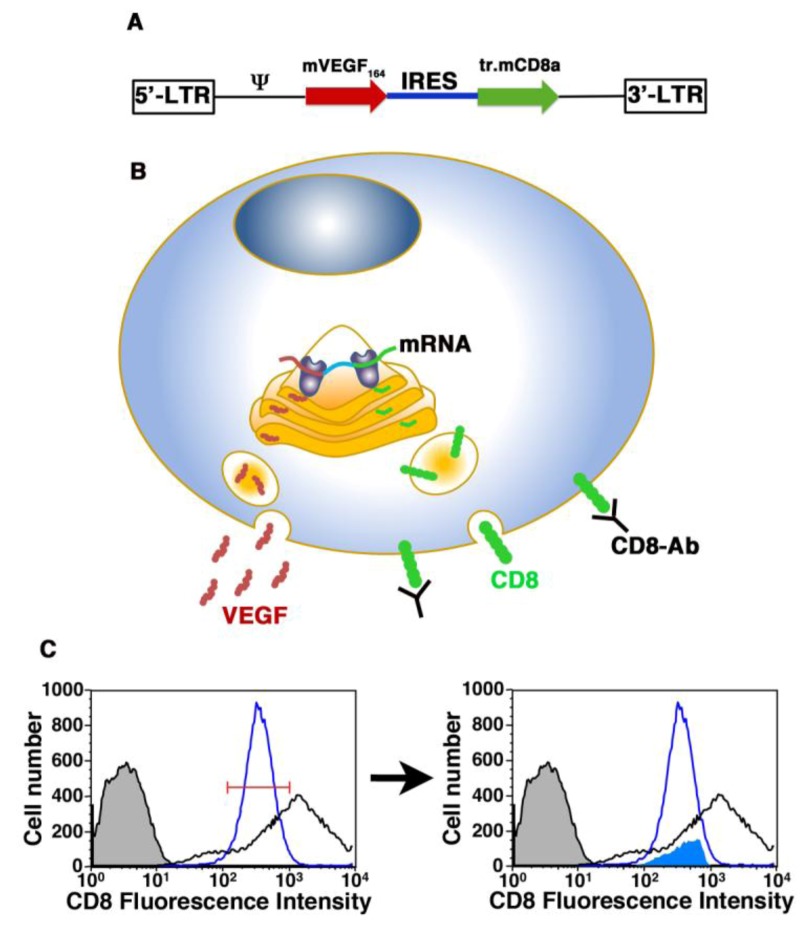
Figure 1.
Schematic representation of the FACS-based cell purification technique. (A) Structure of the retroviral construct (VICD8) used to co-express VEGF (mVEGF164) and a truncated version of CD8 (tr.mCD8a), linked through an Internal Ribosomal Entry Sequence (IRES). (B) In transduced cells, each transcribed mRNA molecule contains both sequences, which are then co-translated by classic cap-dependent and IRES-dependent ribosomal attachment, respectively. Therefore, regardless of the amount of expression from each integrated vector copy, the amount of VEGF protein secreted is always proportional to the amount of truncated CD8 on the cell surface, which can be detected by antibody staining (CD8-Ab) and quantified by FACS. (C) FACS-based purification of polyclonal populations stably expressing specific levels of VEGF and CD8a. The histogram plot in the left panel represents fluorescence intensity of CD8 staining in transduced myoblast populations measured by flow cytometry. Based on the fluorescence intensity of a reference clonal population (empty blue curve) a specific sorting gate was designed (red segment). This gate was applied to the heterogeneous VICD8 population (empty black curve) to sort one specific subpopulation (shaded blue curve in the right panel) that expressed the same level of VEGF as the reference. Negative control cells are represented by the tinted black curve in both panels. Adapted from Misteli et al. [52] and Wolff et al. [53]. Graphics by Dr. N. Di Maggio.

