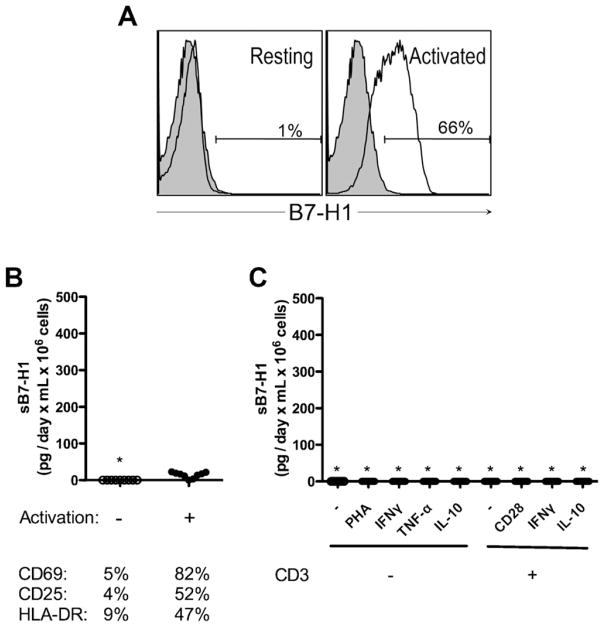
Fig. 2.
T cells do not release measurable amounts of sB7-H1. (A) Expression of membrane-bound B7-H1 (open histogram) in resting (left panel) and activated (right panel) T cells. Shaded histograms represent isotype-matched controls. (B) Measure of sB7-H1 in purified T cells after 3 days of CD3/CD28 bead activation (top panel) and assessment of corresponding activation markers (lower panel). (C) Activation of purified T cells and measure of sB7-H1 after 3 days. Star (*) represents undetectable sB7-H1. Data are representative of 7 to 10 samples analyzed per condition.

