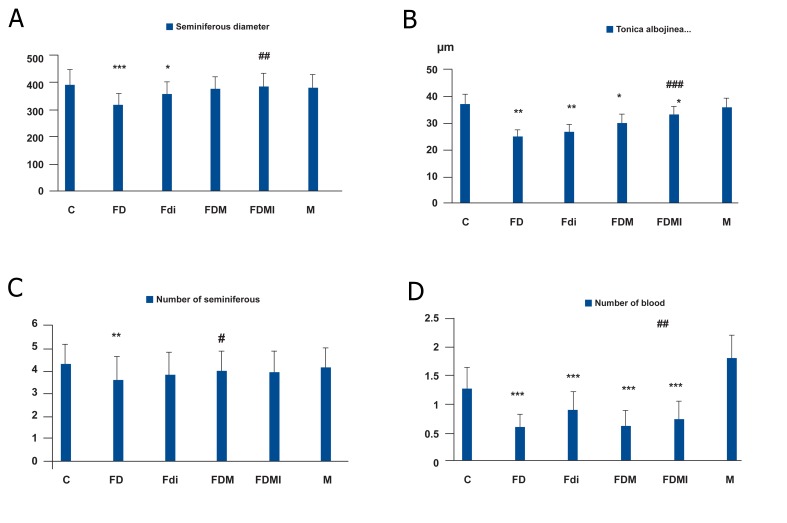
Fig 1.
The seminferous diameter (A) and Tonica albojinea thickness (μm, B) by magnified digital picture, and the number of seminiferous tubules (C) and number of blood vessels by graticule area (about 48 × 48 mm2) in testis tissue sections. The data are expressed as mean ± SD (Standard Deviation) for six rats in each group. Significant difference (p<0.05) between the control group and other groups is shown by (*; p<0.01, **; p<0.001 and ***; p<0.05),, whereas significant difference between the FD group and the FDi, FDM, and FDM groups is shown by (# ; p<0.01, ##; p<0.001 and ### ; p<0.05).

