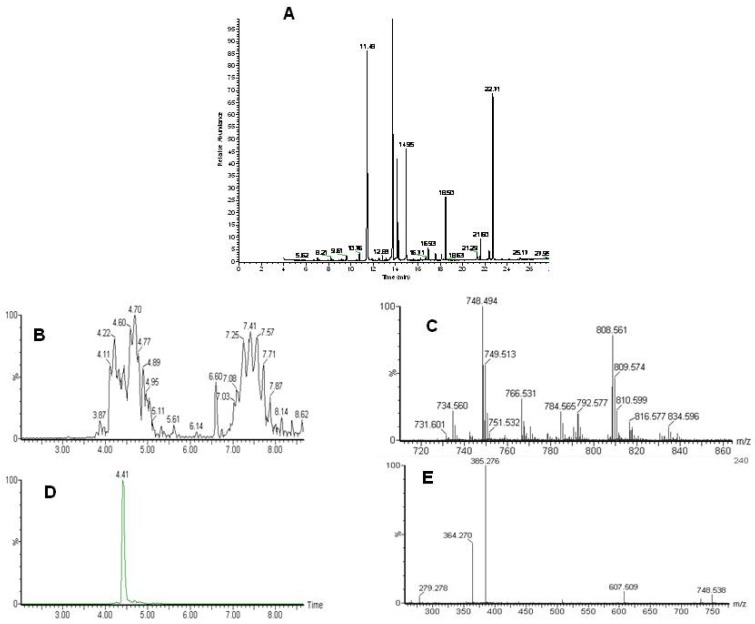
Figure 1.
Analysis of the lipidome by GC-MS and LC-MS. A) A typical GC-MS chromatogram of fatty acid methyl esters in the organic fraction. Typical LC-MS data with identification. B) Total ion chromatogram of the LC-MS analysis of intact lipids. Phospholipids elute between 3.5 and 5.5 minutes and triacylglycerols between 6.5 and 8.5 minutes. C) Single scan mass spectrum from the LC-MS at 4.41 minutes D) extracted ion chromatogram for 748.5 E) MS-MS of 748.5 at 4.4 minutes. Characteristic fragments for a phosphoethanolamine with two fatty acids 22:0 and 22:6.

