Figure 4.
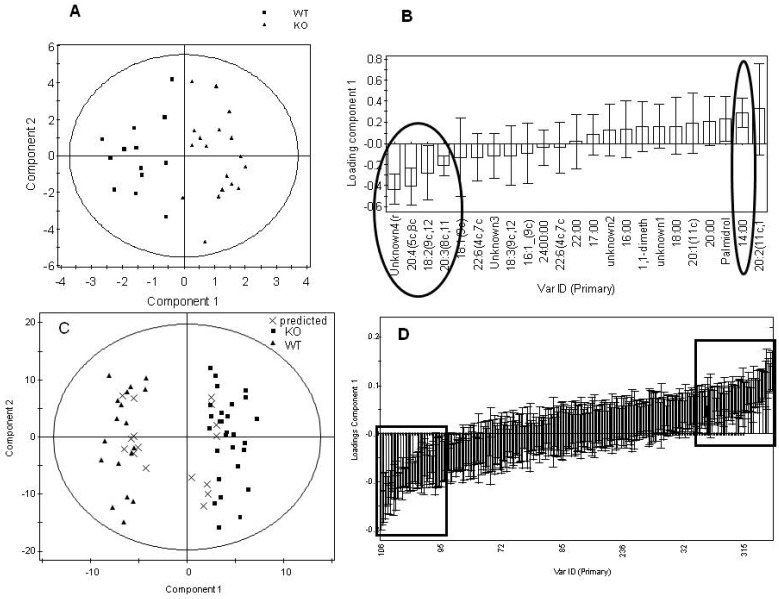
Summary plots for the multivariate analysis of the lipid fraction for the total dataset comparing genotype, regardless of gender. Analysis of organic GC-MS data. A) Scores plot of the GC-MS analysis of the lipid fraction to measure total fatty acid content in tissue from the PGC-1β null mice compared with wild type controls (Q2= 48%). B) Loadings plot sorted by loading value for the model in (A). The variables marked by the ovals were relevant to the model. Error bars represent 95% confidence interval as determined by jack-knifing. Analysis of LC-MS data. C) Scores plot comparing the LC-MS analysis of intact lipids with two injections for each sample comparing tissue from the PGC-1β null mice and the wild type controls (Q2= 89%). Two samples of each male KO, male WT, female KO and female WT were predicted correctly as shown in the plot. D) Loadings plot sorted by loadings value for the model in (D). The variables marked by the boxes were relevant to the model and identified. Error bars represent 95% confidence interval as determined by jack-knifing.

