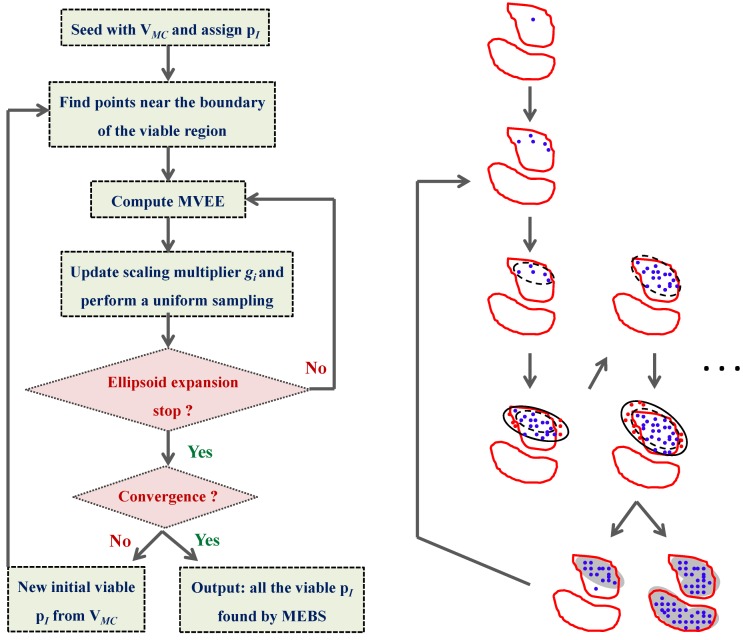
Figure 9.
Flowchart of the multiple ellipsoid-based sampling (MEBS) algorithm. In the right part of the figure, the red closed curves represent hypothetical contour plots of the viable parameter space defined by some criteria. The viable points are marked in blue and the nonviable points are marked in red. Finally, the grey areas illustrate the minimum volume enclosing ellipsoids. This figure is adapted from the original publication [25].

