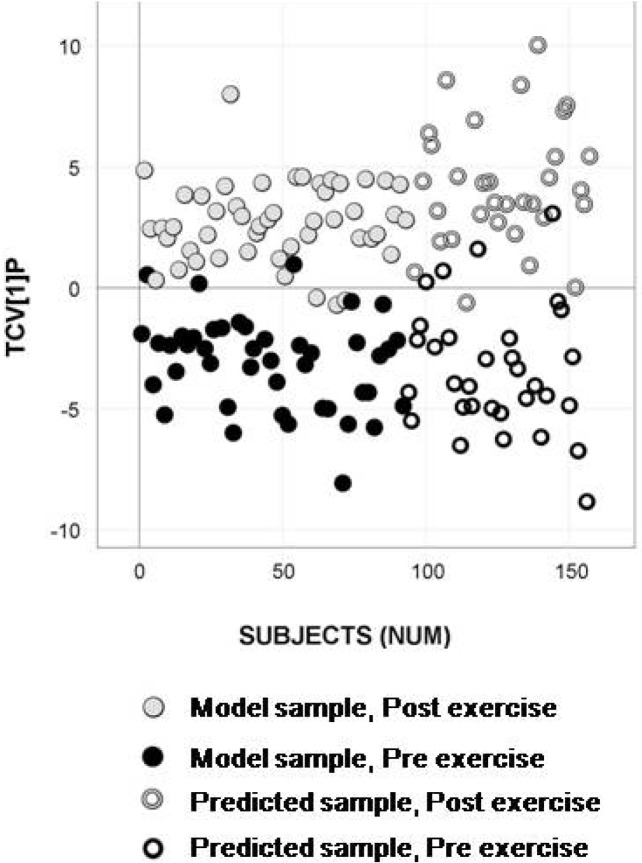
Figure 5.
Longitudinal sample predictions in the classification model of subset selection 2 -analytical data. OPLS-DA predictive score plot of the model updated with the remaining samples from exercise occasion one and two showing separation between pre- exercise (black circles) and post- exercise (gray circles) serum samples (Class prediction (CV): 93.5%). Predicted test samples from exercise occasion three and four marked as open circles display high predictive classification accuracy (Class prediction (Test set): 92.2%) for pre- exercise samples (black open circles) and post- exercise samples (gray open circles).

