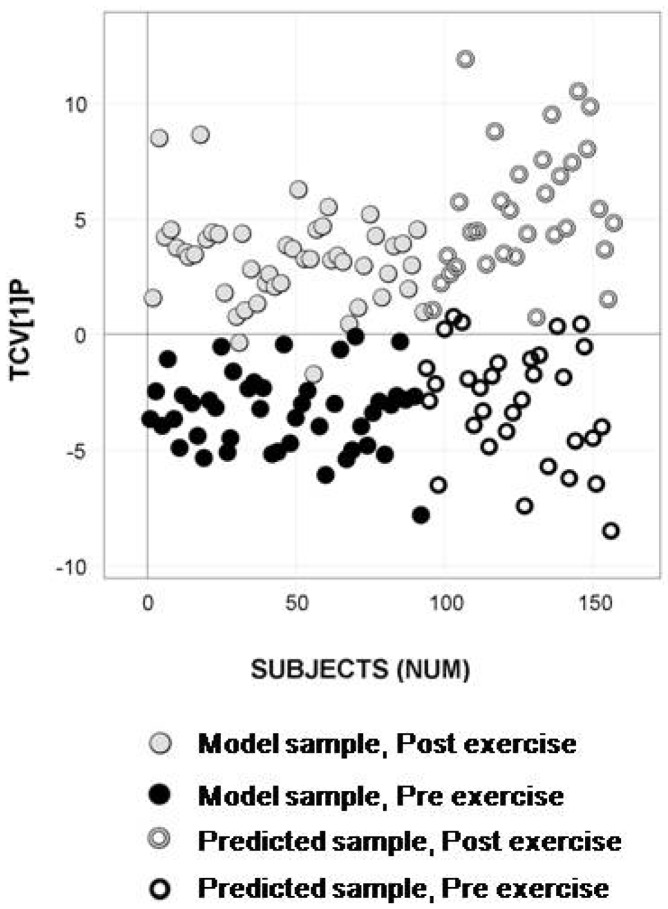
Figure 6.
Longitudinal sample predictions in the classification model for the entire sample set. OPLS-DA predictive score plot for the model based on the 93 samples from exercise occasions one and two showing separation between pre- exercise (black circles) and post- exercise (gray circles) serum samples (Class prediction (CV): 97.8%). Predicted test samples from exercise occasions three and four marked as open circles display high predictive classification accuracy (Class prediction (Test set): 92.2%) for pre- exercise samples (black open circles) and post- exercise samples (gray open circles).

