
Figure 4.
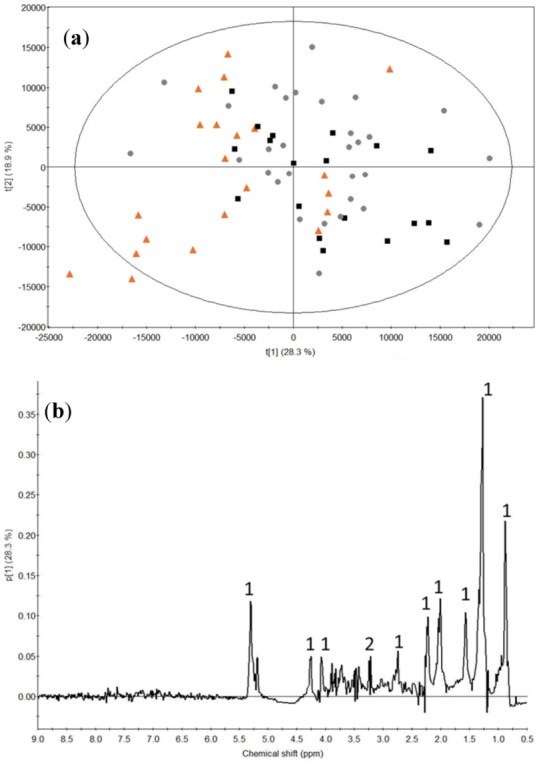
(a) PCA score plot of all baseline subtracted plasma samples showing the different protein sources: orange-triangle, control; black-box, whey protein; grey-dot, calcium caseinate protein. (b) PCA loadings for component 1. Nomenclature: 1, lipid; 2, choline. The ellipse represents the Hotelling T2 with 95% confidence.