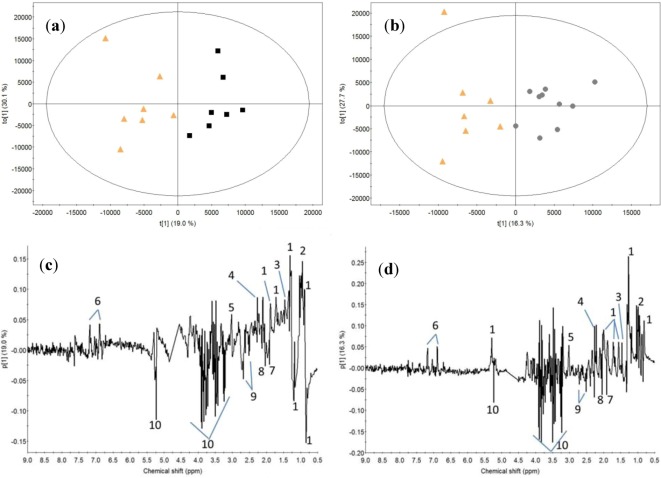
Figure 5.
OPLS-DA score plots discriminating between control and whey (a) and calcium caseinate (b) at 70 min (baseline subtracted) after a bout of heavy resistance. Corresponding loading plot describing the component for OPLS-DA models of control vs. whey (c) and control vs. calcium caseinate (d). Nomenclature: 1, lipid; 2, branched amino acids; 3, alanine; 4, acetoacetate; 5, creatine; 6, tyrosine; 7, acetate; 8, N-acetyl glycoprotein; 9, citrate; 10, glucose. The ellipse represents the Hotelling T2 with 95% confidence.

