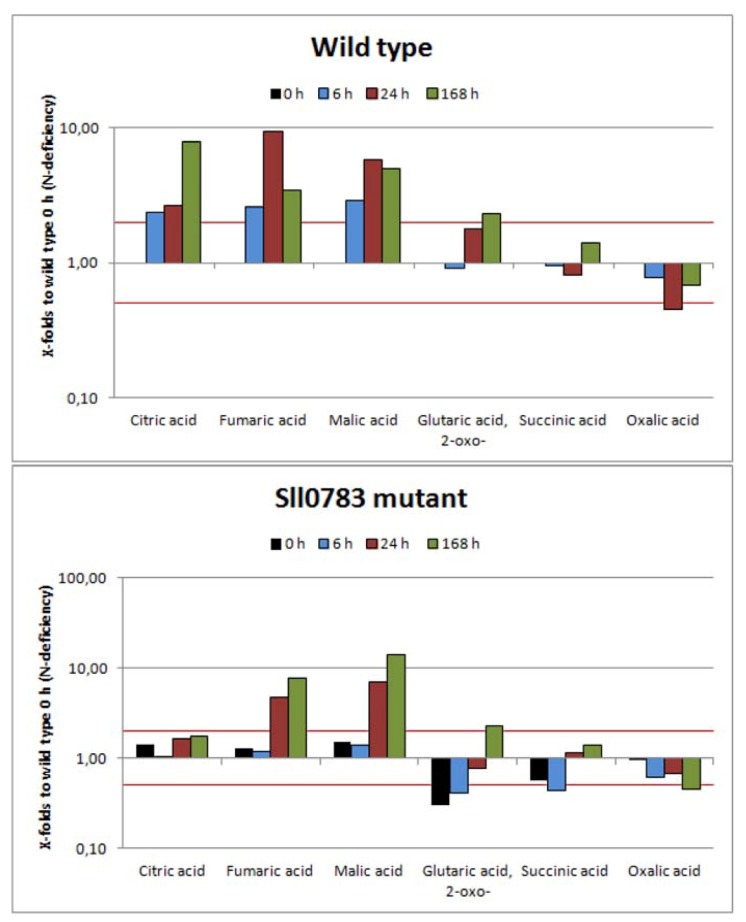
Figure 3.
Levels of tri- and dicarboxylic acid intermediates in wild type and the sll0783 mutant throughout nitrogen starvation. Black bars represent the metabolites levels prior to nitrogen starvation (0 h), cyan bars represent values obtained 6 h, red bars 24 h and green bars 168 h after nitrogen starvation has been induced. All bars represent x-fold changes in metabolite levels compared to the level in wild type at time point 0 h. The red lines mark the values 2 and 0.5. Values above or below these lines represent statistically significant changes of metabolite levels when compared to wild type at time point 0 h.

