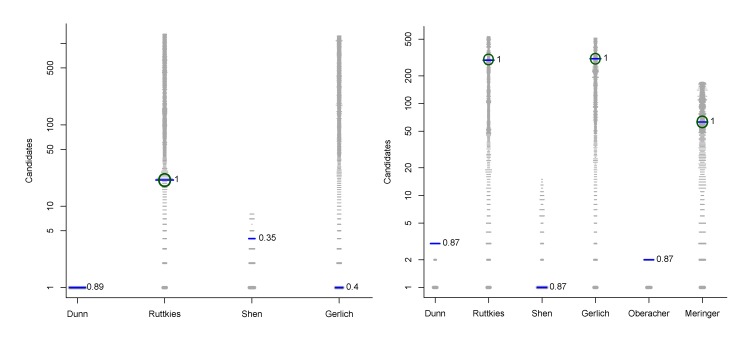
Figure 1.
Similarity calculations for Category 2 entries for Challenges 3 (left) and 10 (right). Each candidate is represented by a grey dash, scaled by the similarity between candidate and the solution. The green circle indicates the correct answer if present; the blue dash indicatesthe most similar compound, with the TS adjacent. y-axis: number of candidates (log scale); x-axis: participant.

