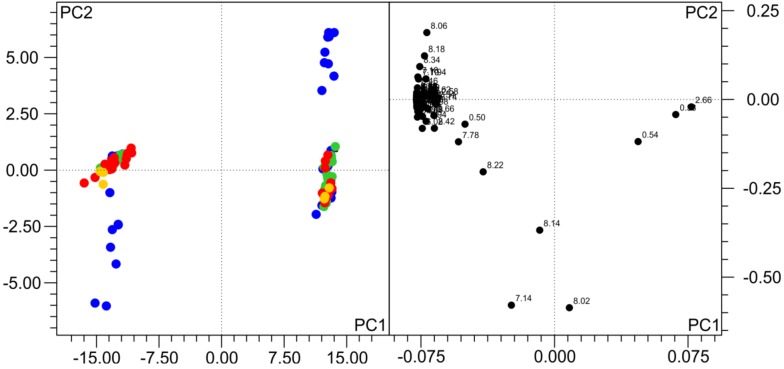
Figure 3.
Principal component analysis (PCA) of 196 samples from the two volunteers frozen and stored under different conditions. Samples colored according to freezing temperature (for the legend, see Figure 1). Subjects are separated in the scores plot (left), but, also, samples frozen on dry ice are distinct from others. The loadings plot (right) shows the variables (bins) responsible for the separation. In the first two PCs > 96% of the variance in the data are explained. R2 = 0.976, Q2 = 0.959.

