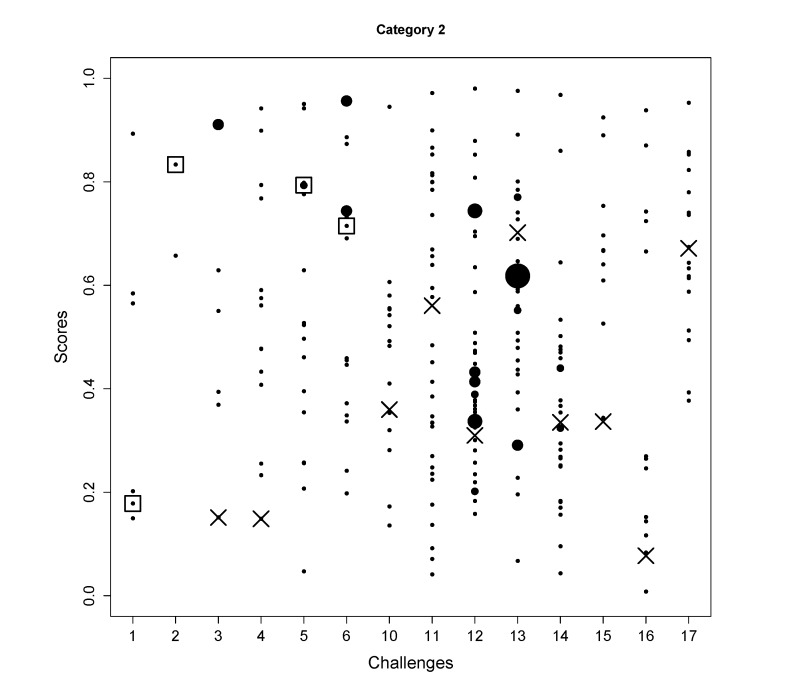
Figure 3.
The scores of all candidates (y-axis) for the challenges (x-axis) are shown in black dots where the size indicates the number of candidates sharing the same scores. The correct solutions are indicated with a square. For the challenges where the correct molecules were not in the database, the hypothetical rankings (assuming the molecules were in the database) of the true molecules are shown by the cross markers.

