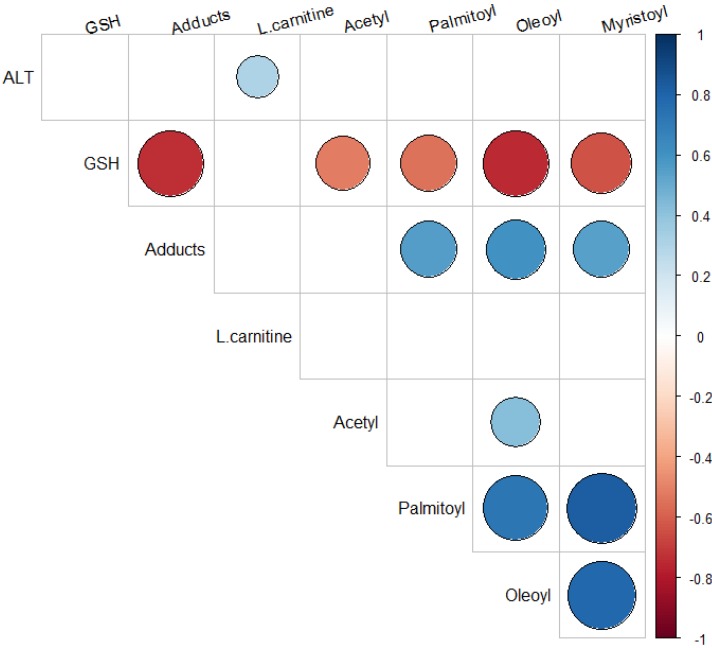
Figure 6.
Spearman rank correlation heatmap between APAP toxicity and metabolism parameters and the acylcarnitines. Statistically significant correlations (p value < 0.05) are shown in blue (positive correlation) and red (negative correlation) color scale. Insignificant correlations are left blank. The larger the circle is the stronger is the correlation.

