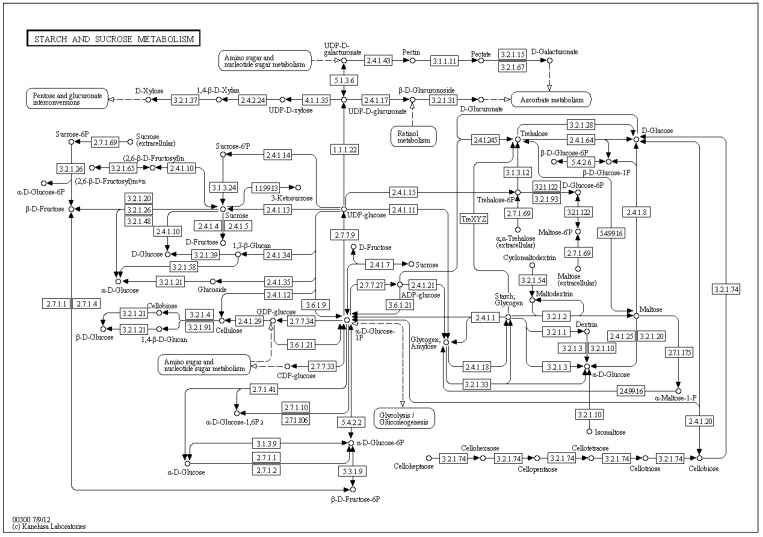
Figure 2.
The KEGG [32] reference map, number 00500, of the starch/sucrose metabolism depicts a bipartite graph. The circles correspond to the metabolites, and the edges represent the enzyme-catalyzed reactions, where the enzyme is denoted by its EC-number in rectangles. The edges are directed and carry no information on stoichiometry.

