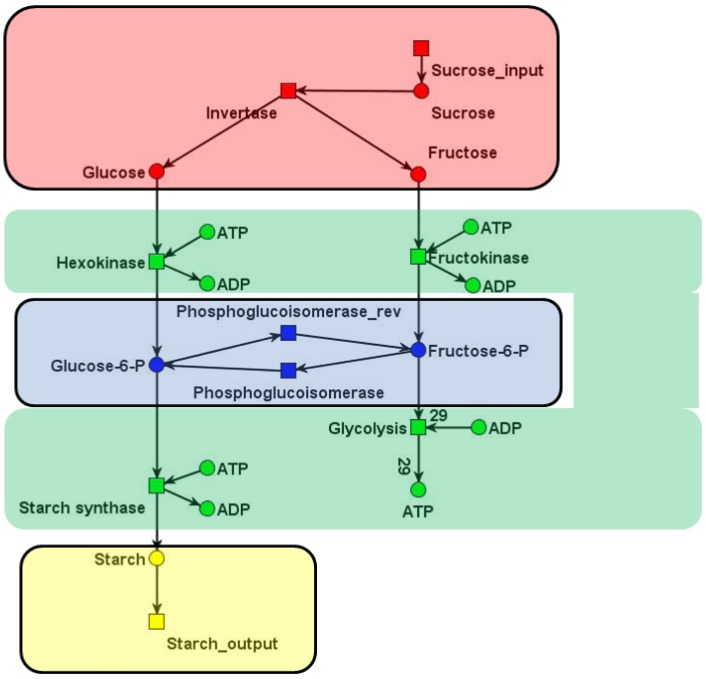
Figure 5.
The structure of modules optimized using a genetic algorithm. Each colored subnet represents a community: the red subnet describes the sucrose uptake and cleavage by invertase; the green subnet covers all reactions, where ADP and ATP are participating; the blue subnet describes the only reversible reaction in the system, and the yellow one stands for the starch production.

