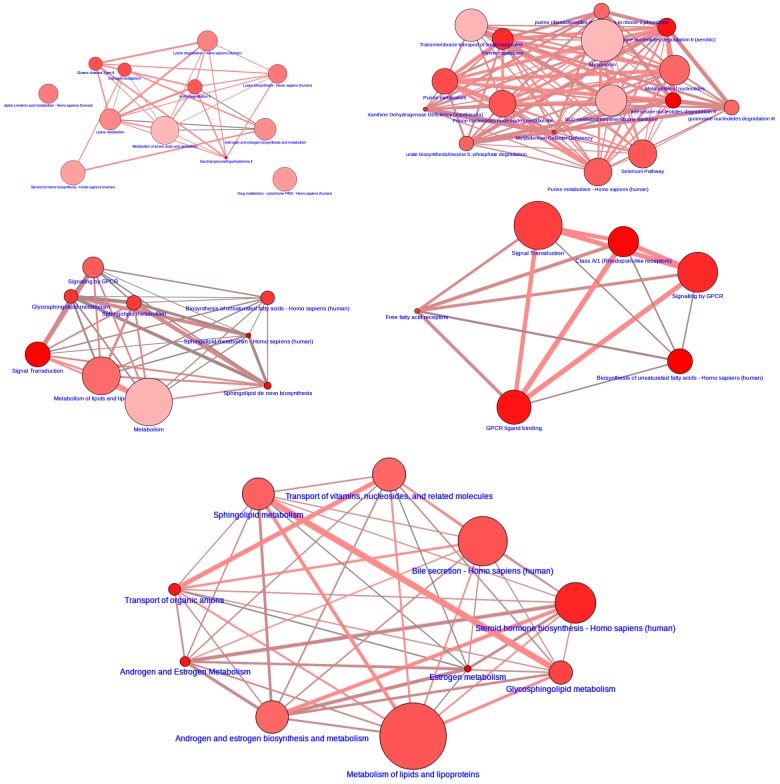
Figure S1.
Pathway networks for Clusters 2,3,6,7,8 (counterclockwise from the left top corner). The node size reflects the total number of components in a pathway; the node color reflects the p-value of the pathway representation analysis (a darker color corresponds to lower p-values); the edge width corresponds to a relative number of shared compounds between the pathways; and the edge color reflects the absolute number in the overlap.

