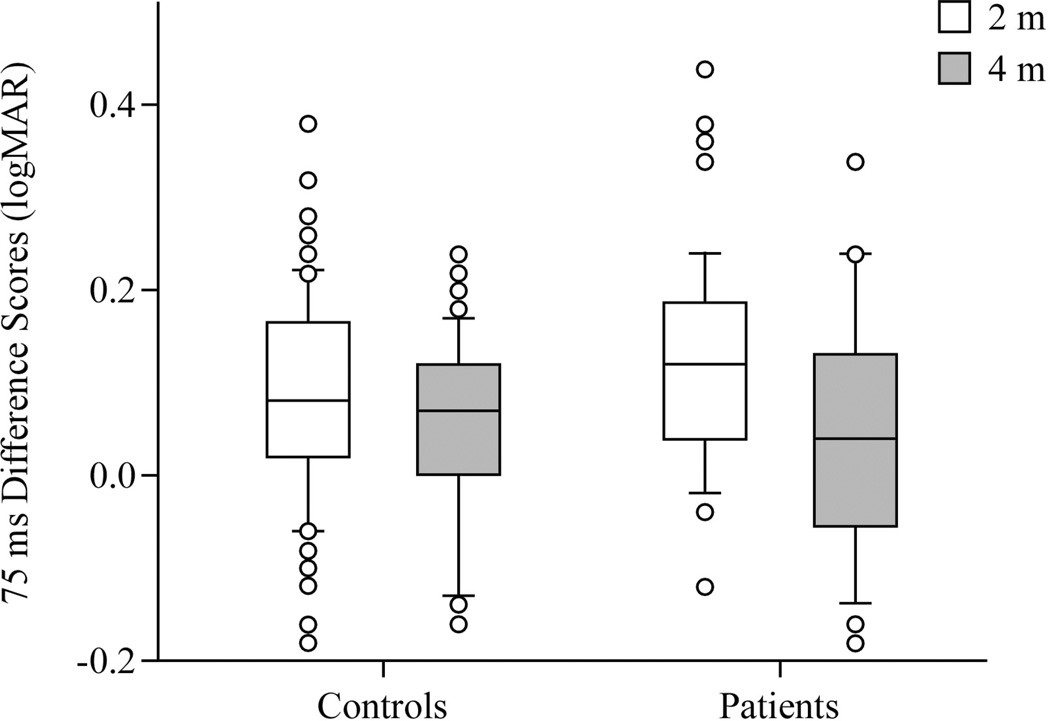
Figure 3.
Difference scores in logMar units, 75 ms duration, at 2 m and 4 distances, comparing historical [12] and current data in healthy controls and patients. Center horizontal bars are medians, rectangle ends are interquartile ranges, error bars are 10th and 90th deciles, and circles are outliers.

