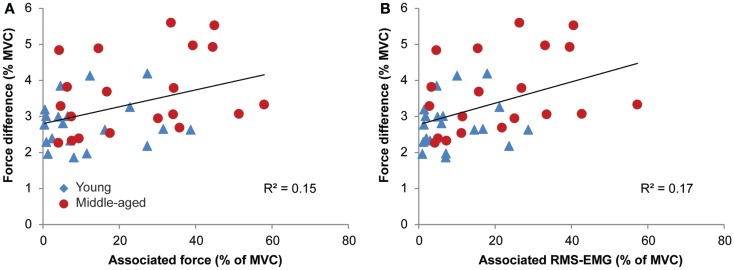
Figure 7.
Relationships between associated activity [EMG and force, in (A,B), respectively] and the measure of bilateral performance, i.e., force difference for young (blue triangle) and middle-aged subjects (red circles). Participants with high levels of associated activity tended to have an inferior bilateral performance.

