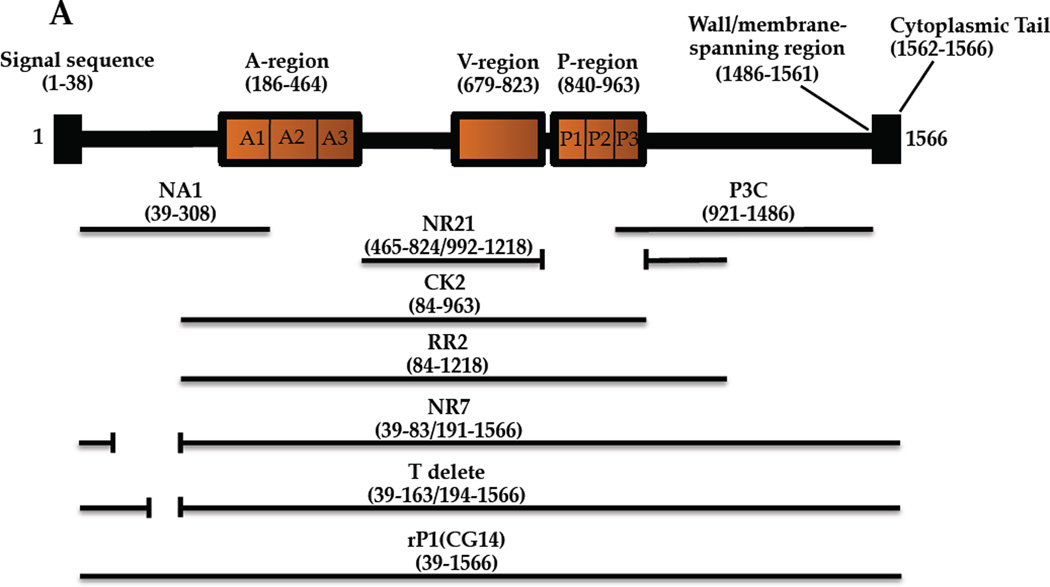
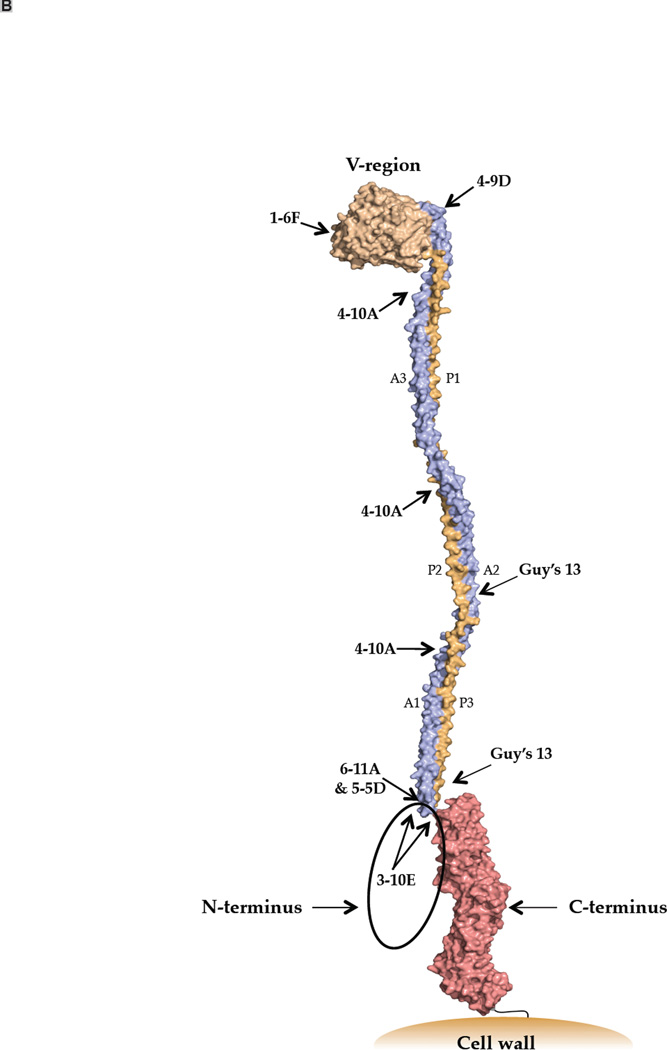
Figure 1.
Schematic representations of S. mutans Antigen I/II illustrating location of putative T cell epitopes and approximate antibody binding sites. (A) A representation of the primary structure of AgI/II and the recombinant polypeptides used in this study. (B) A three-dimensional model of Ag I/II. Approximate binding sites of monoclonal antibodies are indicated.


