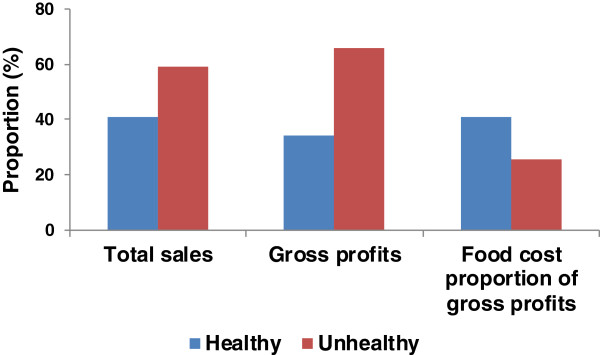
Figure 1.

Total sales, gross profits, and food costs as a proportion of gross profits for healthy and unhealthy items across the five study periods in the target concession. Total sales represents the proportion of items sold that were healthy and unhealthy across all periods. The share of gross profits from healthy and unhealthy items represents the difference between total revenues and total food costs (cost of purchasing raw ingredients) for healthy and unhealthy items, respectively, divided by total gross profits for all items. Food cost as a proportion of gross profits was calculated by dividing total food costs (cost of purchasing raw ingredients) for healthy and unhealthy items by gross profits for healthy and unhealthy items, respectively.
