
Figure 1.
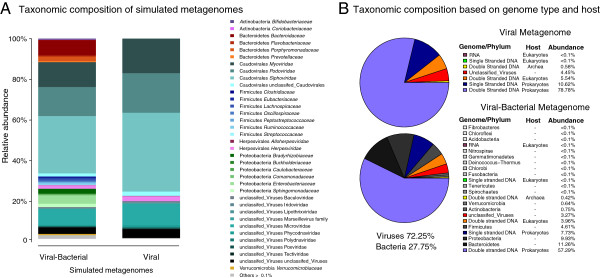
Taxonomic composition from simulated data. Taxonomic composition of the simulated metagenomes (A). All families within a phylum or class are represented in a different color gradient. The unclassified virus category refers to reads with no taxonomic information available at class or family levels. Only families representing more than 0.1% of the reads are shown. Taxonomic composition based on genome type and host (B). The upper chart represents the viral simulated metagenomes, while the lower depicts the viral-bacterial metagenomes. For bacteria, phyla are reported instead of genome types. These are shown in a gray-colored scale.