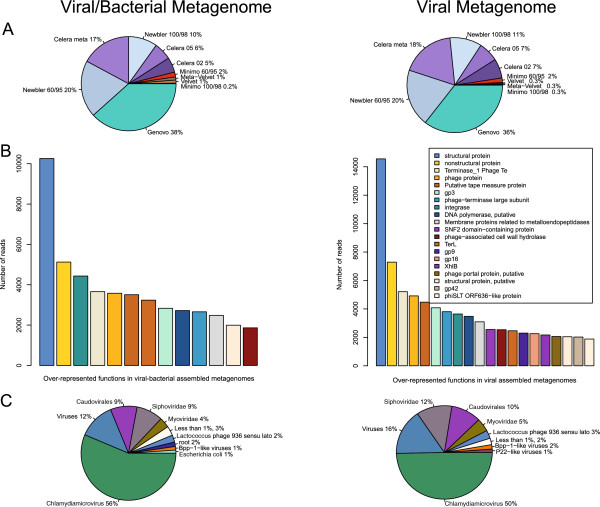
Figure 4.
Functional and taxonomic analyses of chimeric overlaps. Functional and taxonomic representations for the pairwise chimeric collapses for the assemblers is summarized for the viral-bacterial (left) and for the viral (right) metagenomes. Percentage of chimeric collapses for each assembly (A). Bar chart for the over-represented functions in chimeric read collapses (B). Taxonomy percentage of resulting LCA hits (C).

