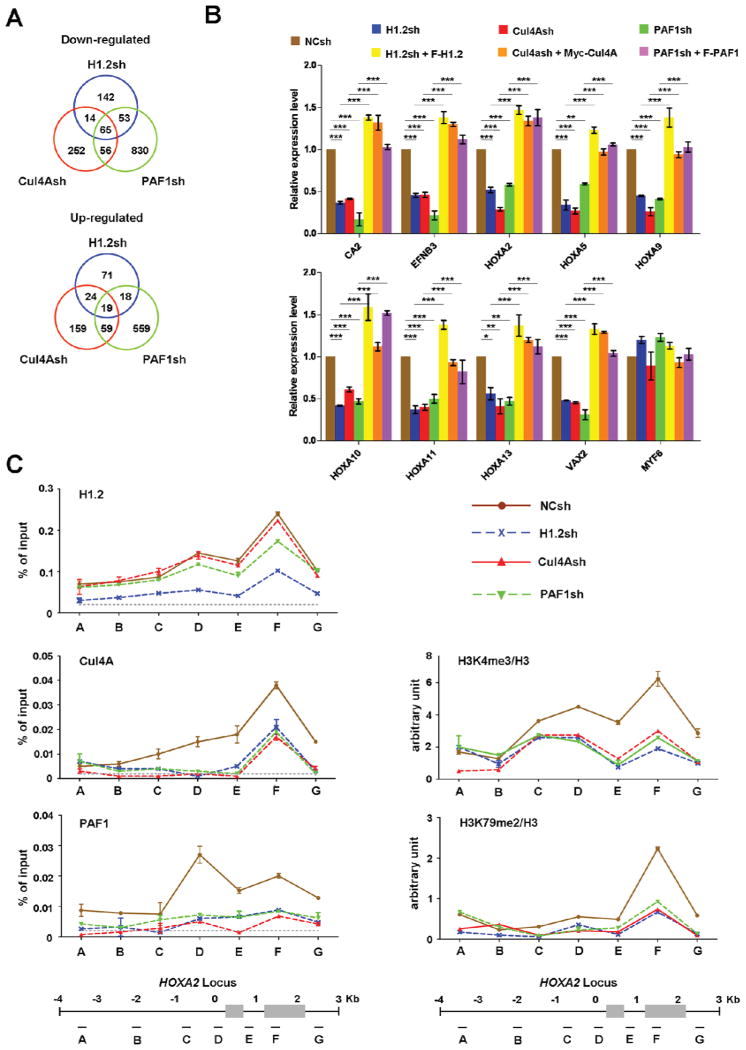
Figure 5. Coordinated actions of H1.2, Cul4A and PAF1 in target gene transcription.
(A) 293T cells were depleted of H1.2, Cul4A or PAF1, and subjected to microarray analysis. Venn diagrams show the overlapping target genes of H1.2, Cul4A and PAF1. See also Table S1.
(B) To validate the gene expression array data, the mRNA levels of the nine down-regulated and one unaffected genes in H1.2/Cul4A/PAF1-depleted cells were quantified by qRT-PCR using primers listed in Supplemental Experimental Procedures. The rescue effects of H1.2/Cul4A/PAF1 expression in H1.2/Cul4A/PAF1-depleted cells were also analyzed as indicated. The values are expressed as fold changes from the mRNA levels in undepleted cells. Results represent the means ± S.D. of three independent experiments (*, P < 0.05; **, P < 0.01; ***, P < 0.001). Statistical tests were performed using one-way ANOVA followed by Bonferroni’s post hoc test.
(C) Chromatin immunoprecipitation (ChIP) experiments were performed in 293T cells depleted of H1.2, Cul4A or PAF1 using the indicated antibodies. Precipitation efficiencies relative to non-enriched input samples were determined for seven locations across the human HoxA2 region by quantitative PCR (qPCR) with primers depicted at the bottom and listed in Supplemental Experimental Procedures. Percentage input is determined as the amount of immunoprecipitated DNA relative to input DNA. Nonspecific background signals obtained from a control rabbit IgG are shown by dotted lines, and error bars represent the standard deviation obtained from three independent experiments. See also Figure S4.

