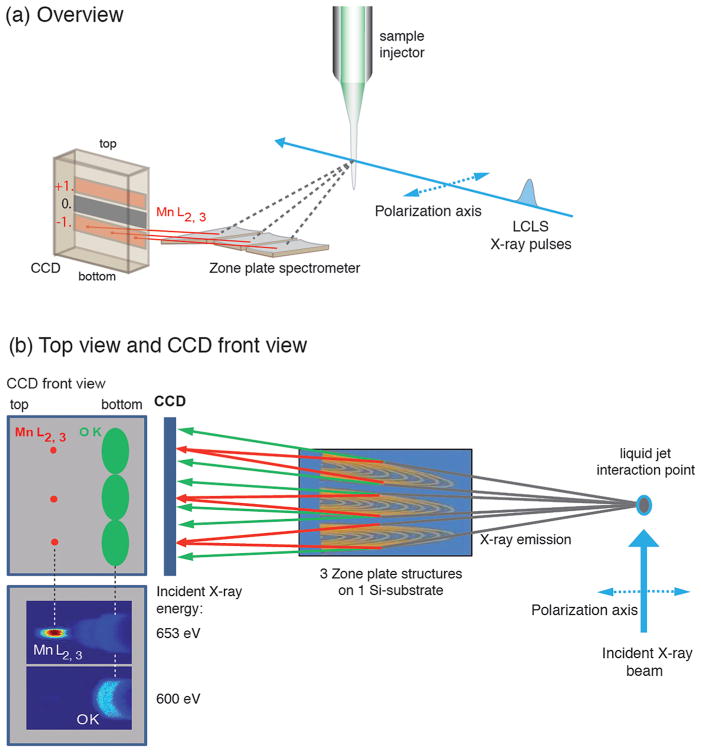
Figure 1.
Schematic depiction of the experimental setup with the high-transmission X-ray spectrometer showing (a) overview and (b) top view with a front view of the CCD camera. (b) Left: CCD front view with schematic depiction of Mn L-fluorescence focused at the top of the CCD (left in the figure), and O K-fluorescence defocused at the bottom of the CCD (right in the figure) and the measured CCD images depicting the fluorescence of a solid MnO sample as diffracted off one zone plate taken at an incident photon energy below (600 eV) and above (653 eV) the Mn L-edge (intensity encoded in color: red high, blue low). The axis of linear polarization of the incident beam is indicated.

