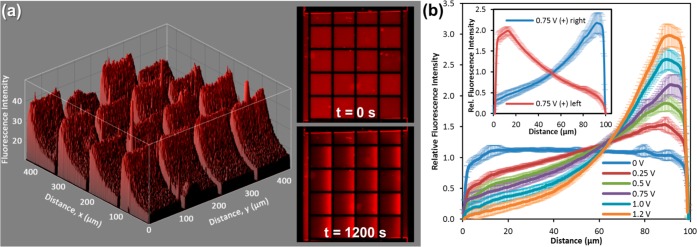
Figure 2.

(a) 3D fluorescence microscopy image of electrophoretic build-up of a TR-DHPE containing lipid membrane after applying 1 V for 20 min, in the presence of 0.5 mM FcCH2OH. Corresponding 2D fluorescence microscopy images are shown at time points 0 and 20 min. (b) Graph showing the relative TR-DHPE fluorescence intensity for different potentials. Inset shows reversal of the direction of electrophoretic migration by reversing the polarity of the electrodes. Data are presented as mean ± SD.
