Figure 5.
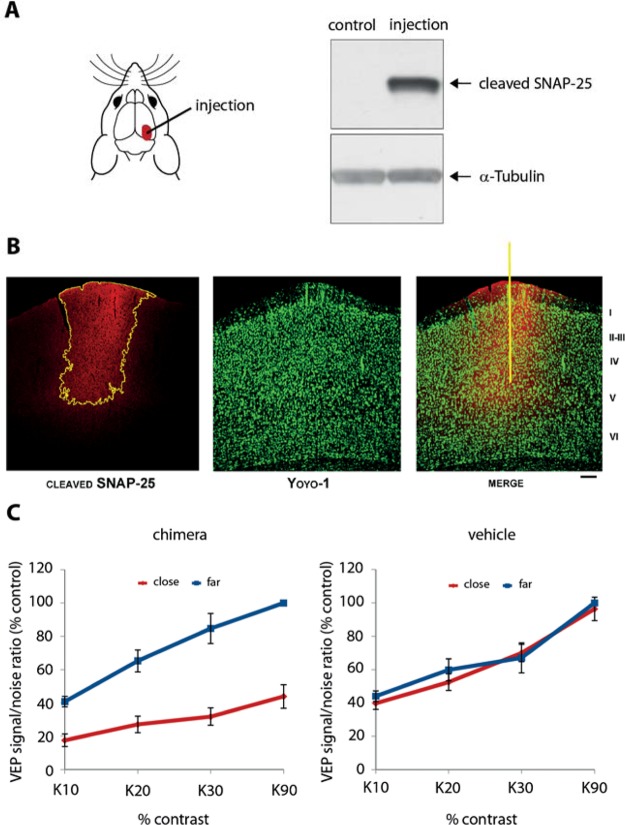
Clostridial chimera attenuates brain activity following localized injection into the rat visual cortex. (A) Schematic diagram showing the injection site of the chimera (left). The brain areas tested were subjected to immunoblot analysis revealing the cleaved SNAP-25 product only in the chimera-injected, but not in vehicle-treated cortex (control). Staining with the anti-α-tubulin antibody indicates equal loading of brain-derived material. (B) Confocal microscopy images of immunostained brain slices showing localized cleavage of SNAP-25 (in red) 4 days following the injection. The yellow contour delineates an intense immunofluorescence observed for the cleaved SNAP-25 product (left panel). YoYo-1 nuclear staining (green) was used to highlight the brain structure (middle panel); the yellow line in the right panel indicates the pipet track. Scale bar = 120 μm. (C) The amplitude of visual evoked potentials (VEPs) as a function of variable contrast (K20–K90) is strongly reduced following the injection of the chimera (left, n = 5) but not the vehicle (right, n = 4) in the visual cortex. The internal standard in each experiment consisted of VEPs measured far (>500 um) from the injection site (blue). In vehicle-injected rats there is no difference between contrast curves measured either close to (red) or far from (blue) the injection site (two-way ANOVA, p = 0.41). On the contrary, in the chimera-injected rats, the contrast curve recorded at the injection site displays significantly lower VEP values (two-way ANOVA, p = 0.006 followed by Holm-Sidak test, p < 0.05). Data are expressed as mean ± SEM.

