Figure 6.
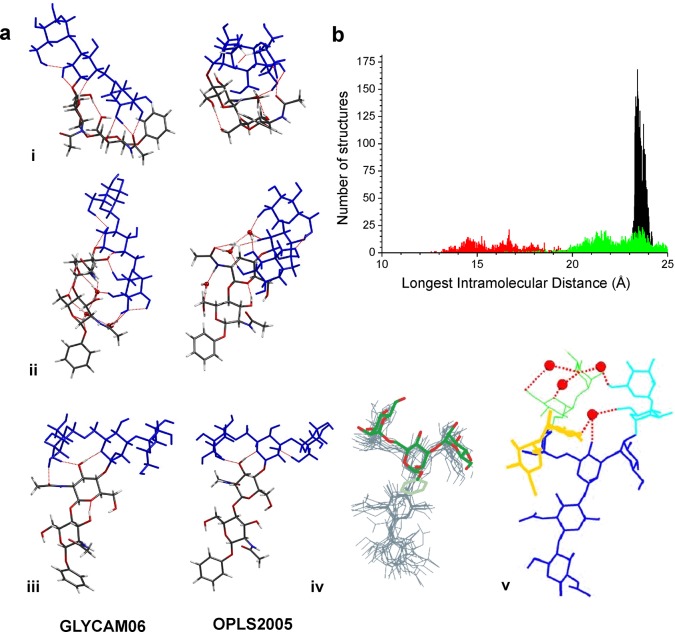
The spectra and structures of the core pentasaccharide 4. (a) The lowest-energy structures of the core pentasaccharide calculated on the OPLS2005 and GLYCAM06/AMBER potential energy surfaces: (i) the isolated molecule; (ii) the triply hydrated complex (the water molecules were initially located at binding sites based upon the preferences of singly hydrated 1, 2, and the trimannosyl ManE(ManD)ManC– head unit15); and (iii) in bulk water, (hydrogen bonds shown in red). (iv) An overlay of the “open” conformer of the trimannosyl ManE(ManD)ManC– head unit and the core pentasaccharide in (v); (v) the preferred aqueous structure of the high mannose glycan, Man9GlcNAc2, determined through NMR measurements and molecular dynamics simulations.12,13 Red dots represent transiently bound water molecules. (b) Distributions of the longest intramolecular distances (for conformers with energies <30 kJ mol–1) in the core pentasaccharide, predicted by molecular mechanics (OPLS2005) simulations: isolated, unsolvated (red), explicitly hydrated (green), and in bulk water (black).

