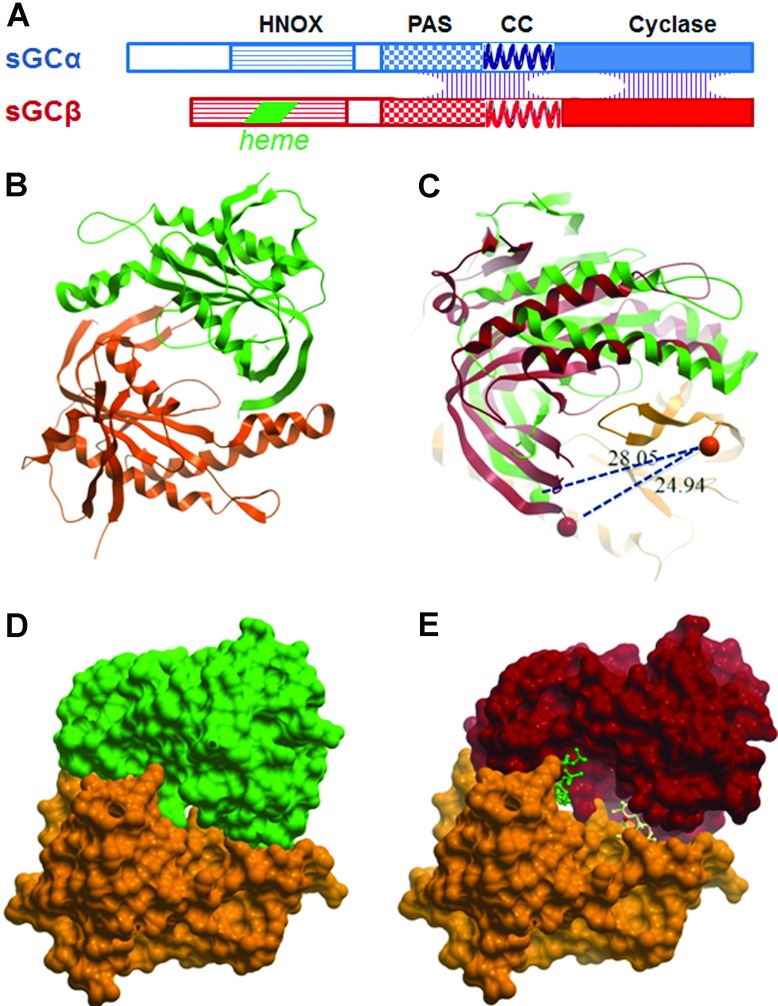
Figure 1. The catalytic domain of human sGC.
(A) Domain organization of the subunits of sGC. Dimerization interfaces are spread along the catalytic, CC and PAS domains. (B) Ribbon diagram of the catalytic domains in the crystal structure of human sGC (PDB code 3UVJ) (α is green, and β is orange). (C) Viewed from above, a rotation of the α subunit between the inactive conformation (green) and an active conformation (red) modelled after the structure of AC. The spheres present the first amino acids of the catalytic domains, showing that the conformational shift results in a change in the distance between the α and β N-termini from 28 to 25 Å, which should affect the interaction with the CC. (D) Space-filling model of the inactive conformation. (E) Model of the active conformation, showing cavities for the substrate GTP (modelled in green) and a potential allosteric regulator at the pseudosymmetric site (depicted in white). These cavities are collapsed in the inactive crystal structure (D).

