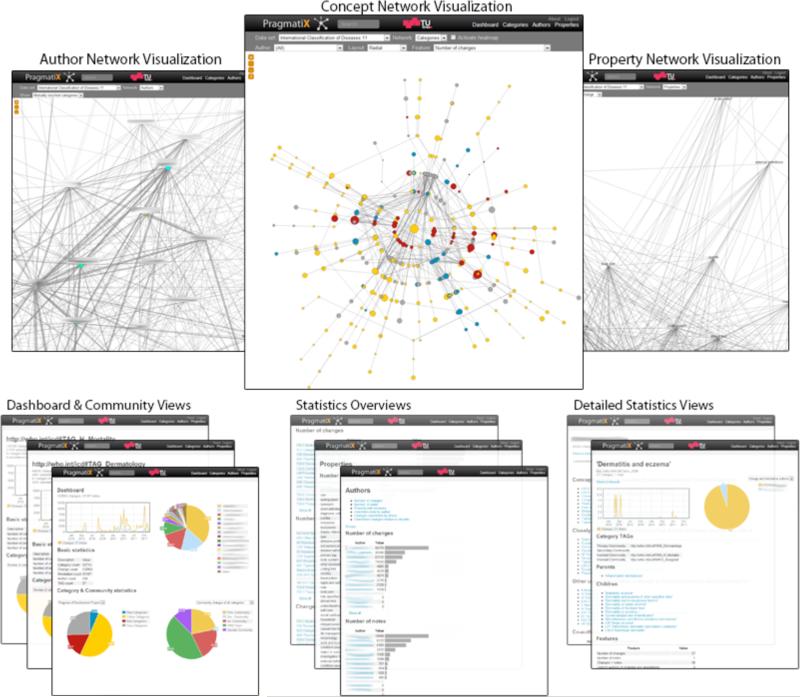
Figure 2.
An overview of all statistics views and visualizations provided by PragmatiX. The tool features three network visualizations (Author, Concept and Property Network), different types of dashboards and overviews as well as very detailed statistics views. The data displayed in this figure is from the ICDG11 data set. The nodes in the network views either represent an author, a concept or a property. While edges in the concept network visualization depict isGa relationships, they vary in the author and properties network visualization according to the currently selected features.

