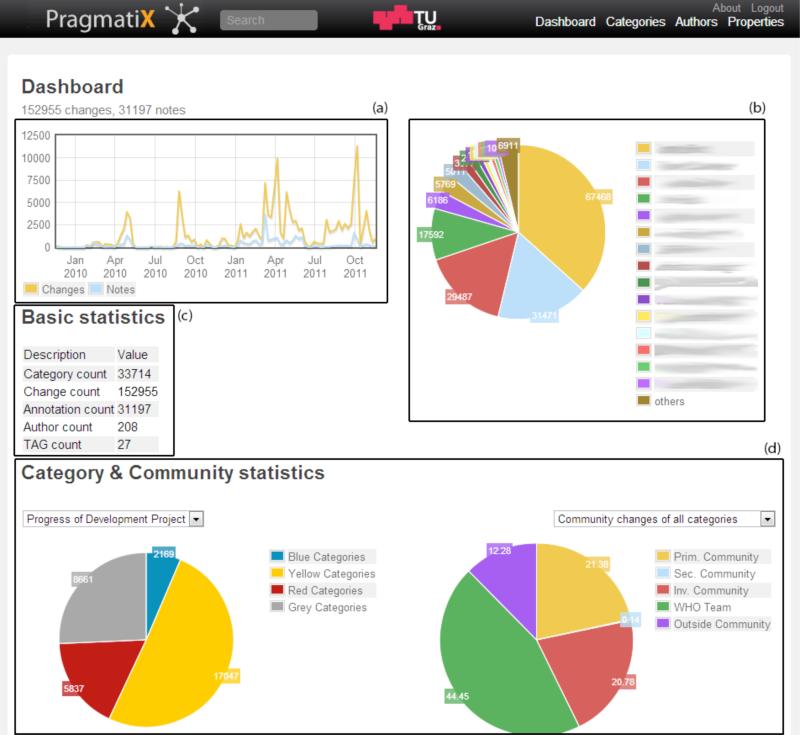
Figure 5.
A screenshot of the dashboard, providing analytical information for the complete ICD-11 engineering process, divided into four elements. Figure 5a shows the total amount of notes and changes performed over time. Figure 5b shows the amount of changes performed by the Top 15 contributors. The Basic Statistics table (Figure 5c) can be used to quantify the size of the ontology, its users and their performed changes and annotations. The Concept and Community Statistics (Figure 5d) provide additional details about the distribution of changes across assigned communities and the overall progress of the project.

