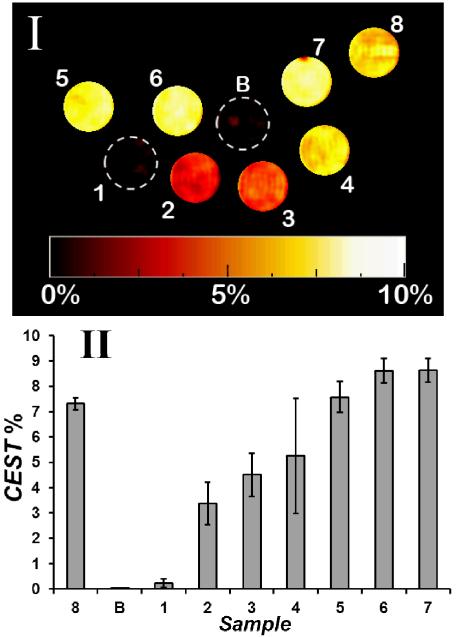
Figure 3.
CEST images of phantoms at 37 °C on a MRI 4.7 T scanner with a pulse train comprised of five Gauss pulses at 12 μT for 1 s, interpulse delay of 200 μs at +/−135 ppm. All solutions contain 40.0 mM HEPES buffer, pH 7.0, 200 mM NaCl, 8.0 mM Co(III)/Co(II) complex . Image (I): 1) [Co(TPT)]3+; 2) [Co(TPT)]3+ and 0.25 eq. Na2S2O4; 3) [Co(TPT)]3+ and 0.38 eq. Na2S2O4; 4) [Co(TPT)]3+ and 0.50 eq Na2S2O ; 5) [Co(TPT)]3+ 4 and 0.75 eq. Na2S2O4; 6) [Co(TPT)]3+ and 1.0 eq. Na2S2O4; 7) [Co(TPT)]3+ and 1.25 eq. Na2S2O4; 8) [Co(TPT)]2+. Scale represents the percent loss of signal due to CEST. Chart (II) represents phantom image intensities (average of three experiments).

