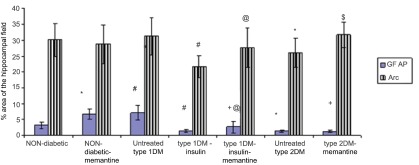
Figure 14. % area in the hippocampal field of glial fibrillatory acidic protein (GFAP) and Arc in the different studied groups assessed by immunohistochemistry.

*: significant compared to non-diabetic group, +: significant compared to non-diabetic-memantine group, #: significant compared to untreated type 1 diabetic group, @: significant compared to type 1-insulin group, $: significant compared to untreated type 2 diabetic group at p<0.05. Data are presented as mean±SD (n=6/group).
