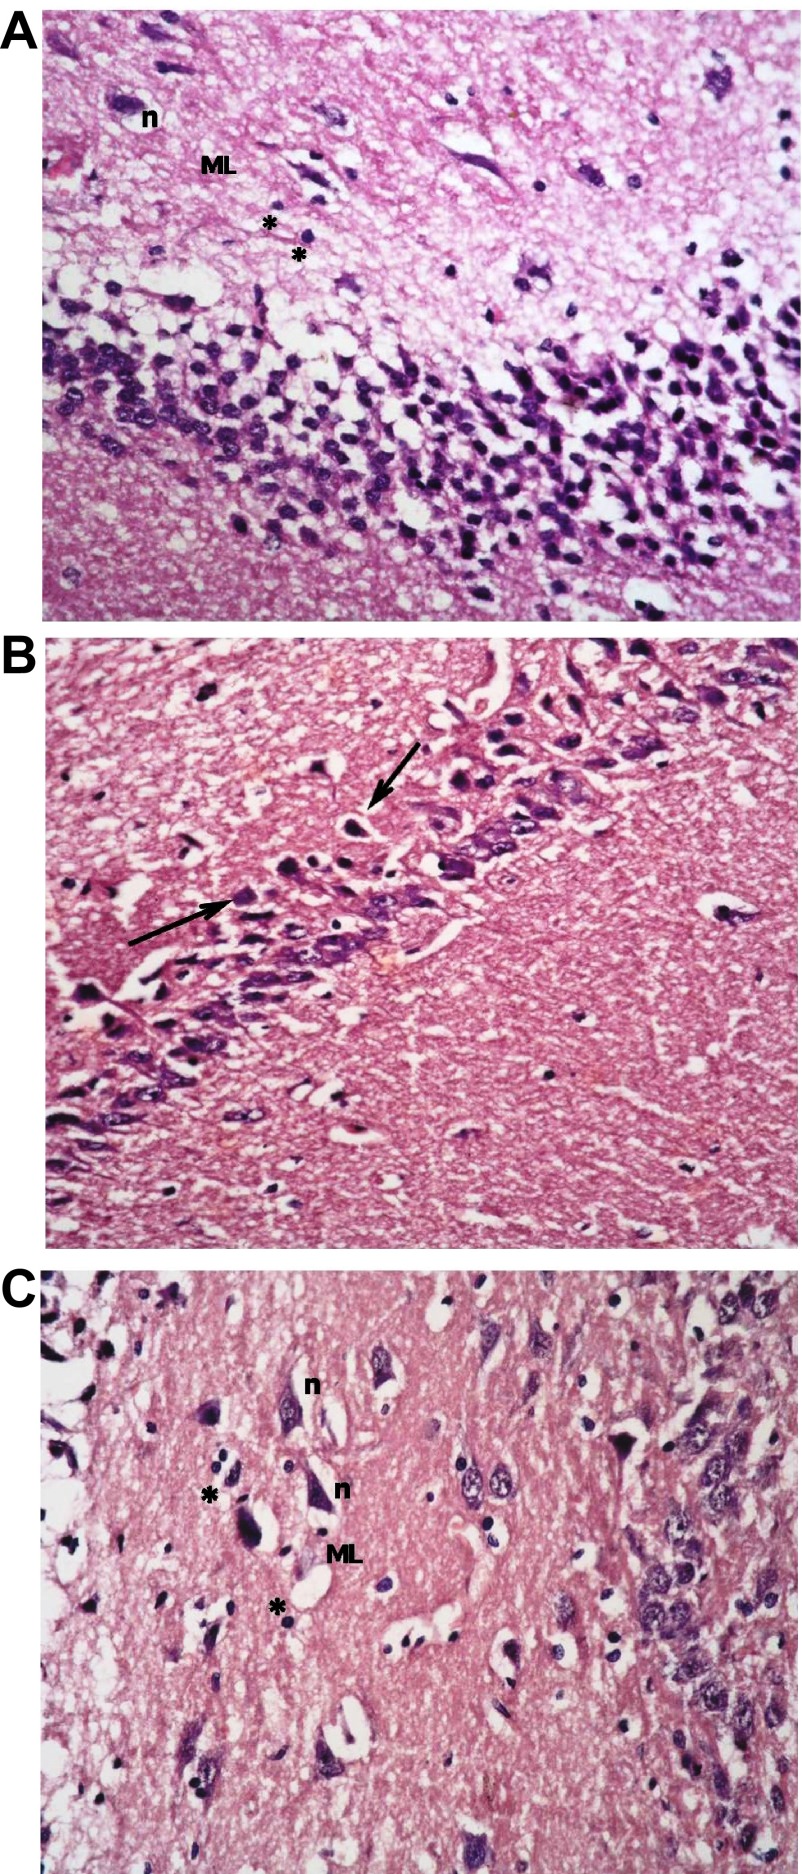
Figure 9.
The untreated type 1 diabetic group shows ( a): disorganization and areas of cell loss of small pyramidal cells; some having pale nuclei and others dark. Note also clumping of neuronal processes. ( b): marked shrinkage in size of large pyramidal cells, affecting outer layer more, with darkened nuclei (↑). ( c): Granular cell layers also showed marked vacuolations. Molecular layer (ML) shows marked enlargement of neurons (n) and of glial cells (*).

