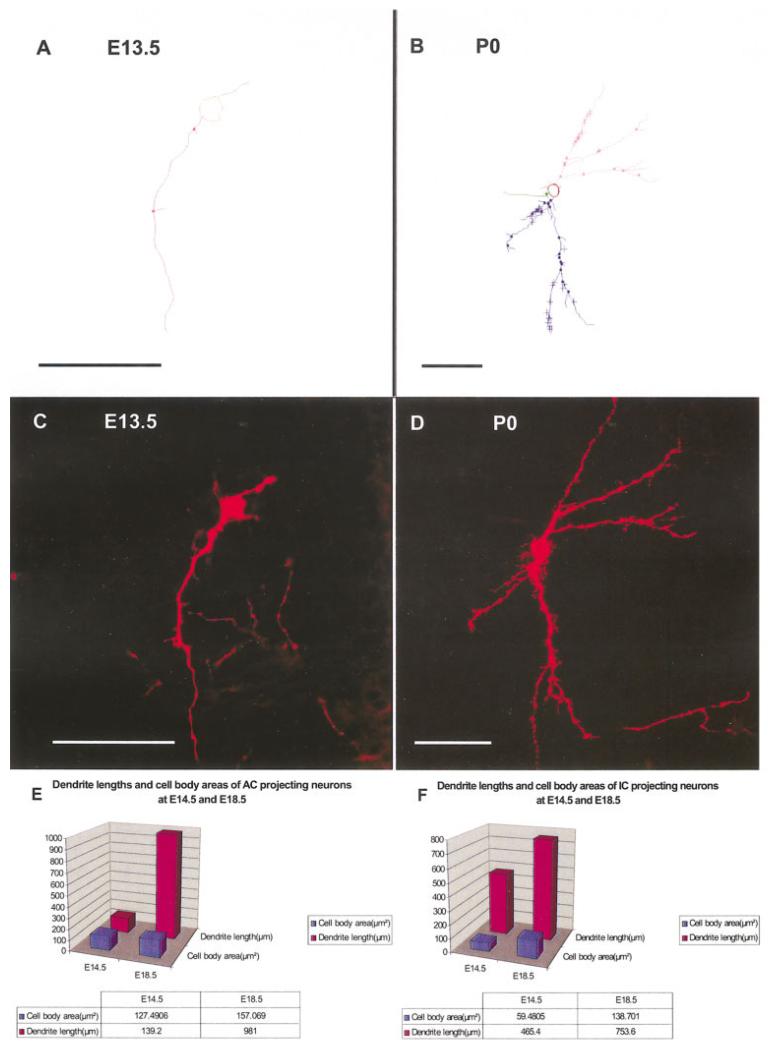
Fig. 10.
Dendritic analysis suggests differential growth of cortical and collicular projection neurons. A-D: We used confocal image stacks and Neurolucida software to analyze the branching pattern of individual neurons that could be imaged entirely. These cells showed increased complexity and more elaborate dendritic trees over time. E,F: We quantified the total area and length of all dendrites in at least three individual neurons of two stages, and the comparison of the means showed a tendency for the growth of the total length of the dendrites to be more profound in the cortical projecting neurons (E) than in the collicular projection neurons (F). E, embryonic day; P, postnatal day. Scale bars = 50 μm.

