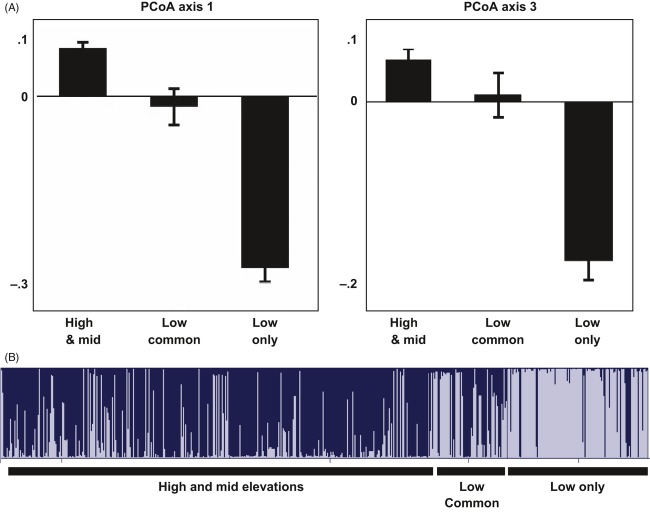
Figure 3.
Distinctly low populations are differentiated from both high- and mid-elevation samples and samples of common varieties found in low sites. (A) Low varieties show differentiation on the first and third axes of a PCoA on all individual genotypes. Mean and standard error of values for each group are shown. (B) STRUCTURE analysis identifies the majority of low-variety samples as belonging to a distinct population; common low samples are split between the two inferred populations.

