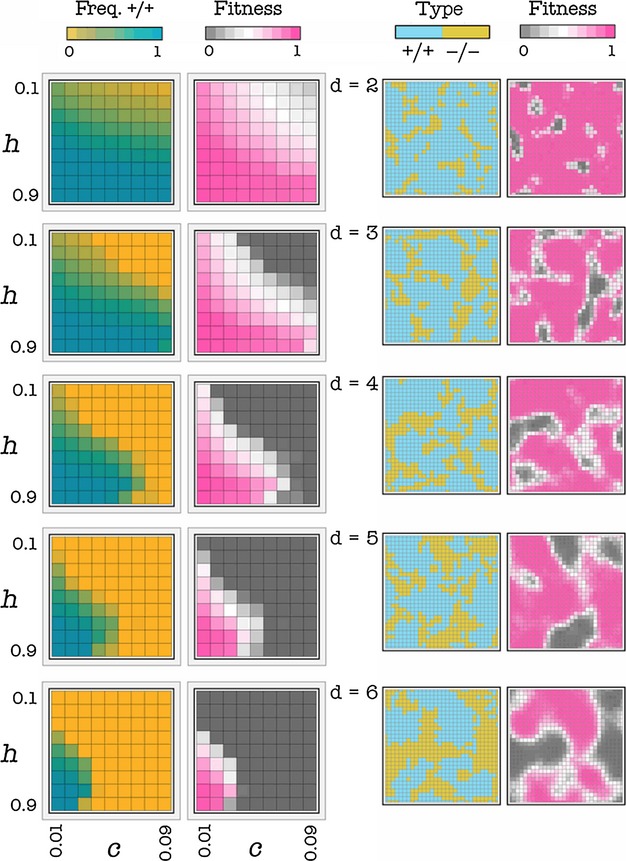
Figure 3.

Effect of the diffusion range. Left: Each square in each plot shows the frequency of +/+ cells or the average fitness of the population (its growth rate) as a function of h (the position of the threshold) and c (the cost of production), for a given d (diffusion range) and for s = 20 (deterministic update). The frequency of +/+ cells and the average fitness are higher at intermediate levels of h and at low values of c. Both decline with increasing d, that is, increasing group size. Right: Snapshots of the population after 1000 generations per cell; c = 0.01, h = 0.5, s = 20, deterministic update.
