
Figure 5.
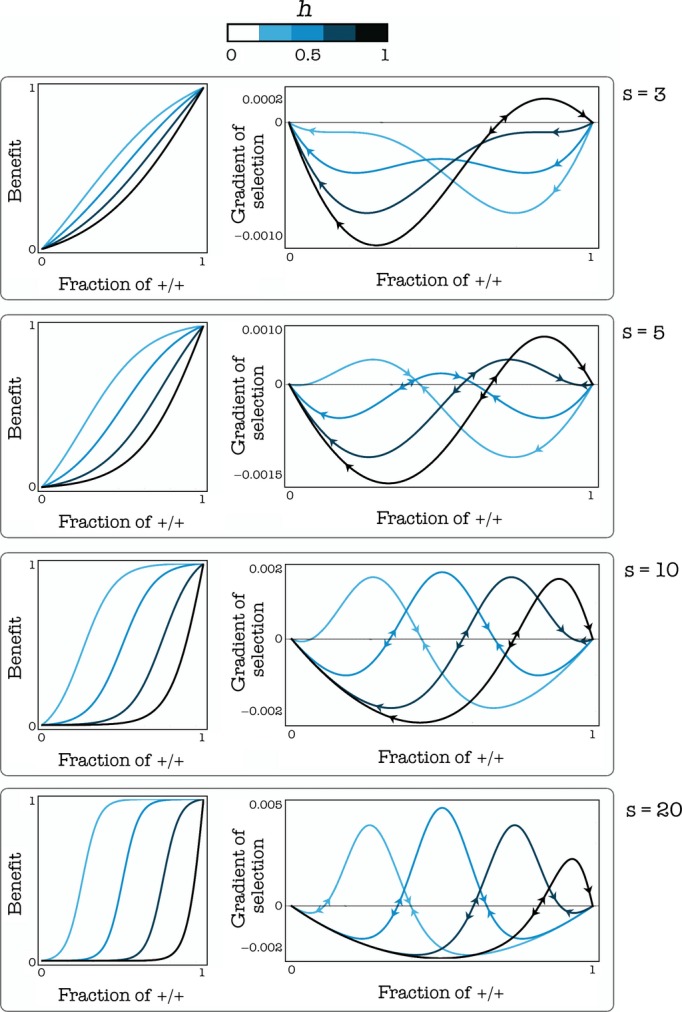
Evolutionary dynamics and equilibria. Left: The benefit functions and the gradients of selection for given values of s (the steepness of the benefit function) and h (the position of the threshold). The sign of the gradient of selection determines the dynamics (arrows show the direction of the change in frequency of +/+ individuals); equilibria occur where the gradient of selection is zero. c = 0.02; β = 1; d = 3