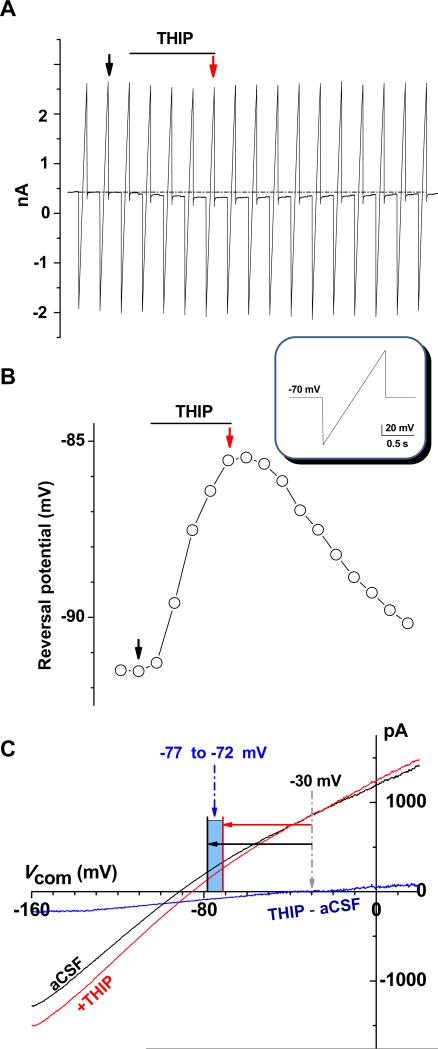
Figure 2. Astrocytic GABAA-R currents.
A. Gramicidin perforated patch recording from an astrocyte; the cell was held at −70 mV and a 1 second long voltage ramp from −160 mV to +20 mV was delivered every 20 second to induce currents (inset below A). Addition of 100 μM THIP shifted the holding currents downwardly (dotted line). B. Chronological display of reversal potentials of ramp induced current traces shown in A. The black and red arrows in A and B pointed to the ramp induced current traces and their corresponding reversal potentials in aCSF control and THIP application, respectively. C. Black and red traces in A are plotted against the applied voltages. THIP induced GABAA-R currents (blue) were resolved by off-line digital subtraction of red trace from the black trace that yielded an apparent EGABAA-R of −30 mV. As the voltage ramp induced currents carried a 75% of voltage error, the error correction yielded the actual EGABAA-R in the range of −77 mV to −72 mV for this recording.

