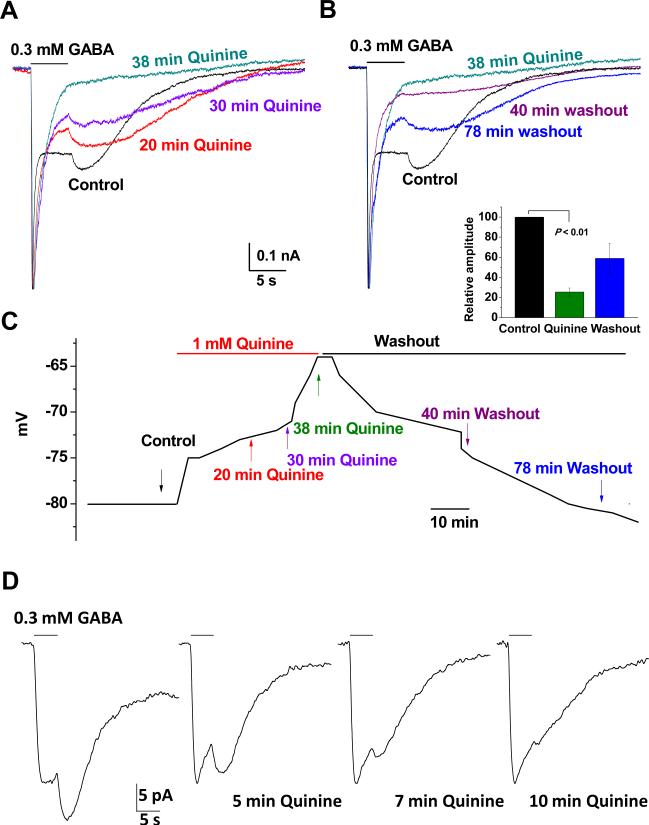
Figure 8. Quinine inhibition of GABA induced DIC.
A. Time-dependent inhibition of GABA induced DIC by bath application of 1 mM quinine. 0.3 mM GABA induced receptor currents and DIC at different times by focal application. After control recording, 1 mM quinine was bath applied that inhibited the DIC in a time-dependent fashion. B. Continued recording from the cell in A. After washout, the DIC appeared 78 min later with 57% recovery in current amplitude. Quinine inhibition (inset) was calculated and presented as IDIC/IGABA_R that decreased to 25.5% of the control level in the end of 40 min of quinine application. C. Change in Vm during quinine application and washout for the cell shown in A and B, where quinine produced Vm depolarization, coincided with the quinine mediated DIC inhibition. D. DIC remained in Cs+ a recording solution that was inhibited in a time-dependent fashion. The holding level of the recording traces in A, B and D were normalized to the same level for comparison of DIC amplitude.

