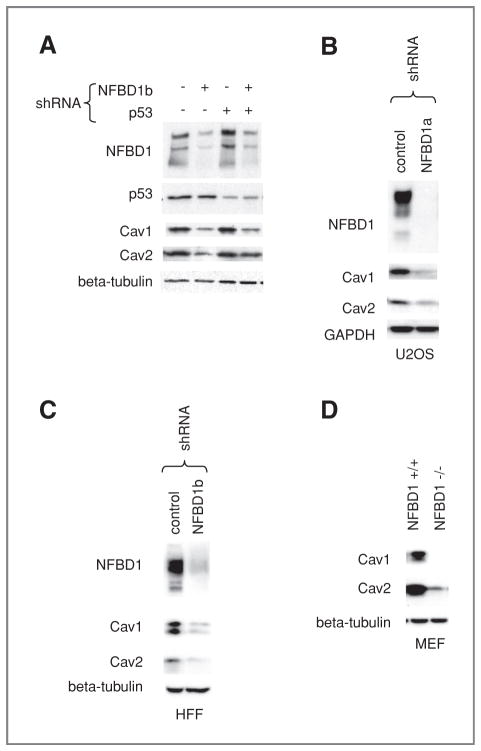
Figure 3.
Effect of NFBD1 depletion on Cav1 and Cav2 protein levels. A and B, U2OS cells or C, HFF cells were infected with the indicated shRNAs. A–C, two days after infection, cells were lysed. A, the NFBD1, p53, and beta–tubulin loading control blots are also shown in Fig. 1C (four left-most lanes). D, NFBD1+/+ and NFBD1−/− MEFs were lysed. A–D, western blots were carried out on lysates using the indicated antibodies.

