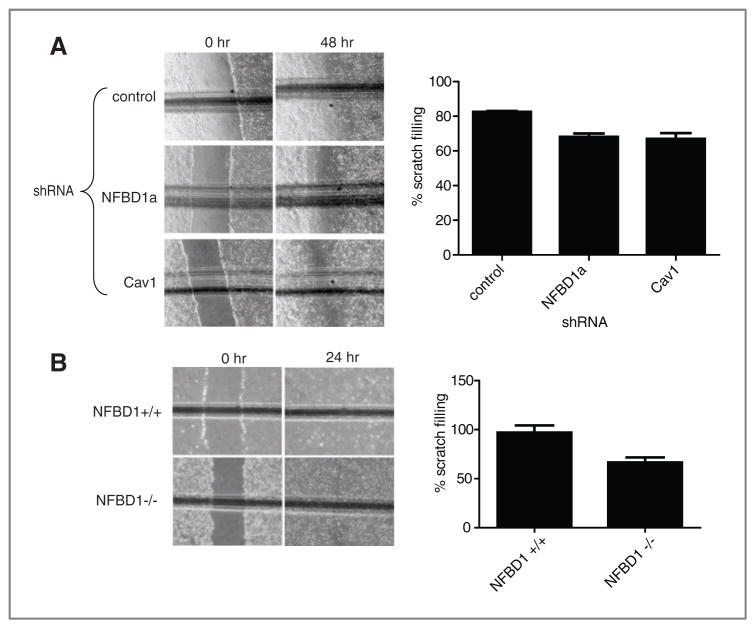
Figure 5.
Effect of NFBD1 depletion on scratch filling. A, U2OS cells were infected with control, Cav1, or NFBD1a shRNA-expressing retroviruses. Cells were allowed to grow three days after infection to reach confluency. B, NFBD1+/+ and NFBD1−/− MEFs were plated to reach confluency. A and B, a scratch was made with a pipette tip. Cells were immediately washed twice with DMEM with 0.1% FBS and then incubated in Dulbecco’s modified eagle medium (DMEM) with 0.1% FBS for the indicated time points. The horizontal line represents a scratch on the outside of the plate to ensure that the same part of the scratch was examined at both time points. The percentage difference between the width of the scratch at the 0-hour time point and the 24-hour or 48-hour time point is plotted. Error bars represent the standard deviation among six samples, three different scratches from each of A, three or B, two biological replicates.

