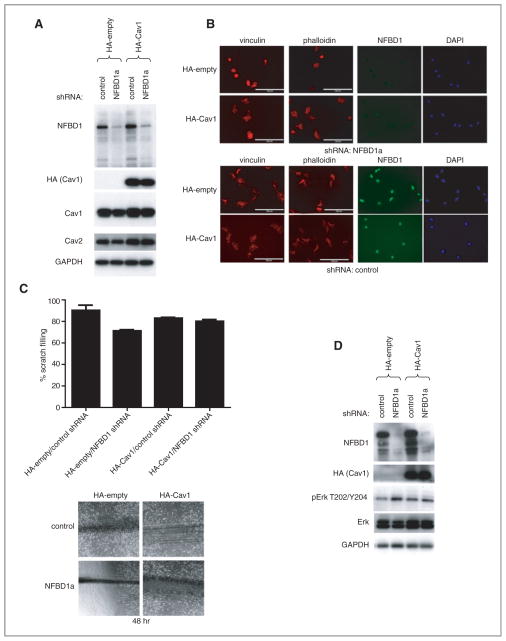
Figure 7.
Effect of restoring Cav1 levels on NFBD1 depletion. U2OS cells were stably transfected with control or an HA-Cav1 plasmid. These cells were infected with either control or NFBD1a shRNA-expressing retroviruses. A and D, western blots were carried out on cell lysates using the indicated antibodies. B, cells were plated onto fibronectin coated chamber slides and immunofluorescent analysis was carried out using the indicated antibodies. Actin was stained with Texas Red-phalloidin. Scale bars are 100 μm. C, scratch assays were carried out as in Fig. 5 on the cells. (Top) Results are quantified, and error bars represent the standard deviation of three biological replicates. Representative images 48 hours after the scratches were made (bottom).

